Chatbot interaction statistics
You can always track how many users interacted with certain chatbots and how. View graphs and data summaries for specific periods to analyze the necessary information for each chatbot individually.
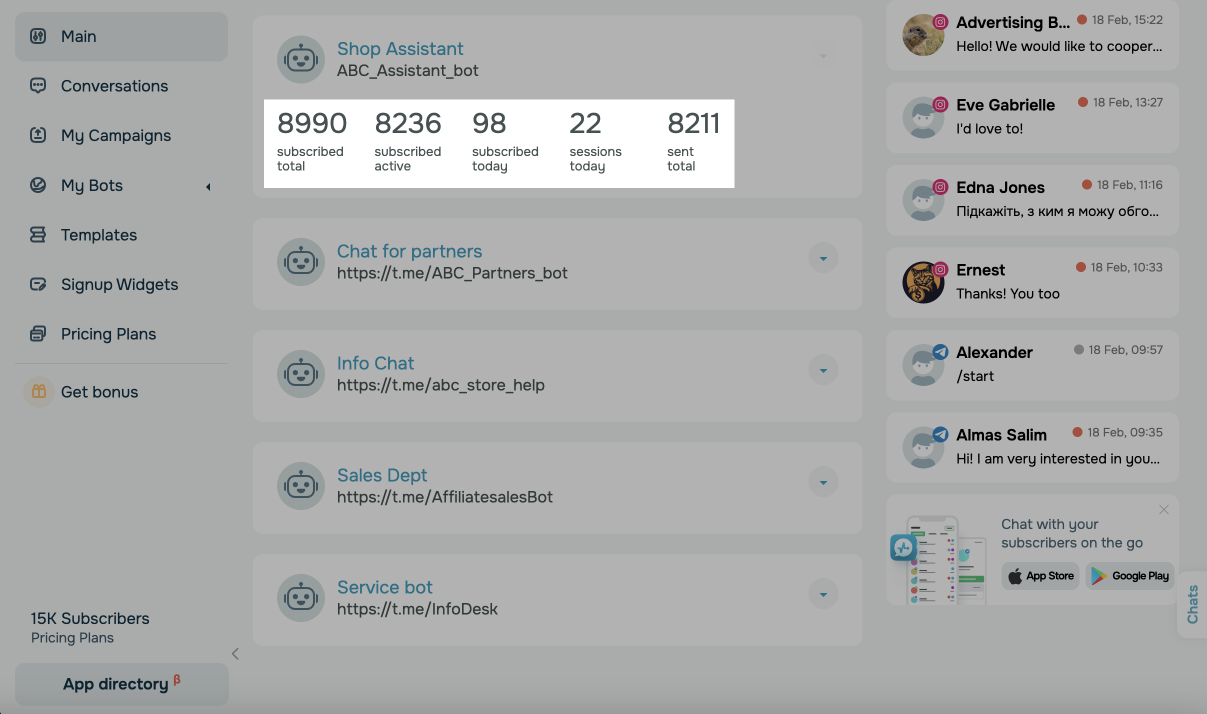
Chatbot performance statistics
On the main page of the Chatbots section, you can find the necessary information on your chatbots on all channels:
| Subscribed total | The total number of subscribers in your chatbot's Audience. |
| Subscribed active | The total number of subscribers with the Subscribed and New user statuses. |
| Subscribed today | The number of new users who subscribed on the current day. It is displayed according to the time zone set in your General account settings. |
| Unsubscribed today | The number of users who unsubscribed. |
| Sessions today | The number of users who have interacted with your chatbot: clicked on buttons in messages, sent messages, and started or continued a flow. A session lasts for 24 hours from the moment a user first sends a message. |
| Sent total | The total number of messages sent to users. |
Chatbot statistics chart
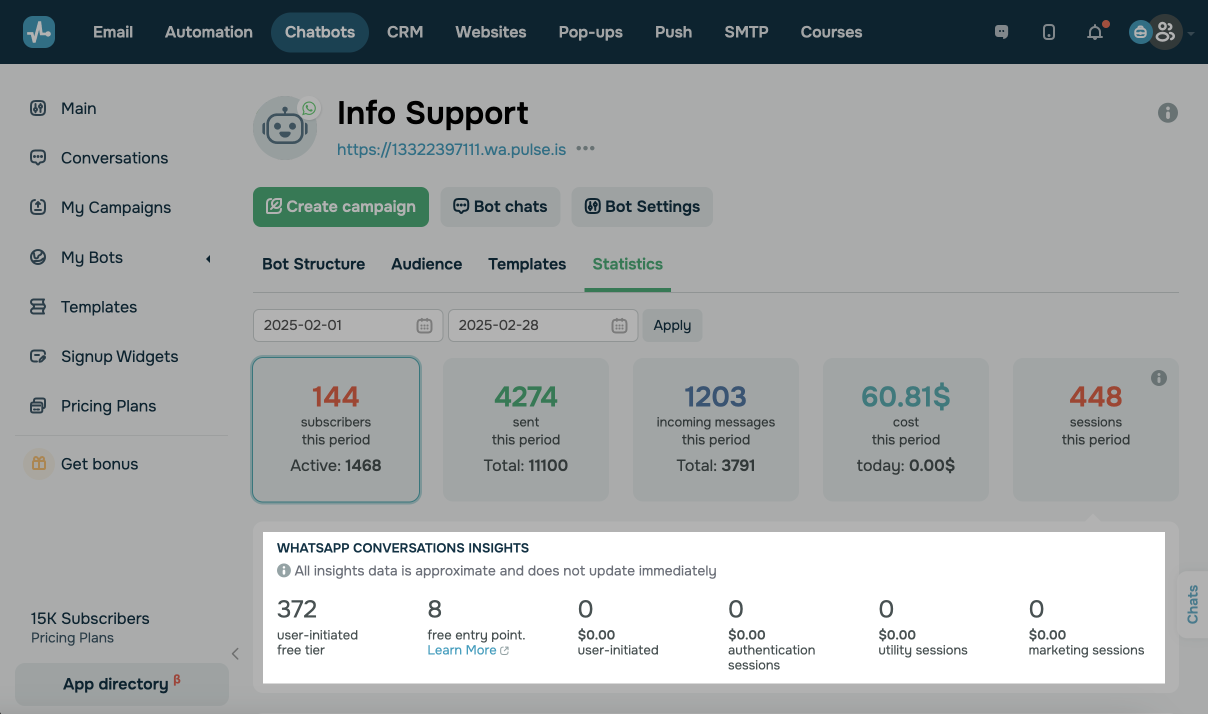
You can also view your chatbot's performance statistics for a selected period on a graph. To do this, select your chatbot, and go to the Statistics tab.
Afterward, you need to select a period and click Apply.
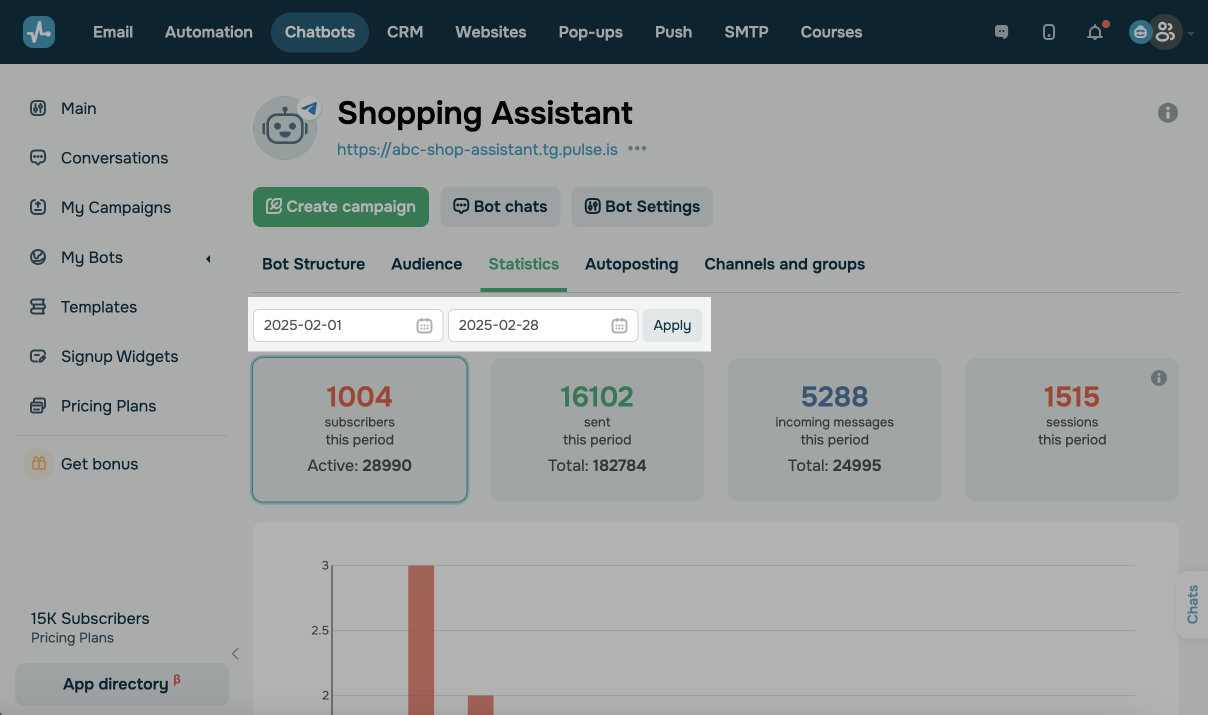
Select an indicator for your graph.
The statistics are displayed in the UTC+0 time zone.
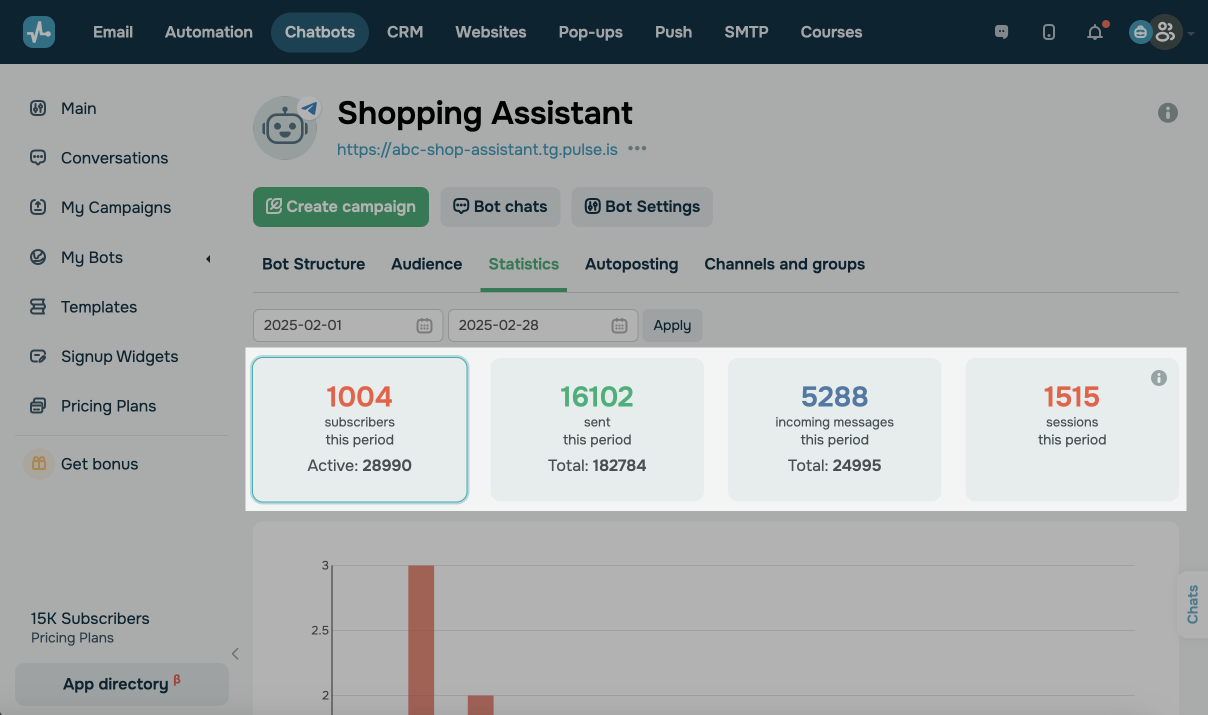
Subscribers acquired during this period
Here you can see the number of your new subscribers for a selected period. You can also find the number of your active subscribers for the whole period of your chatbot's work below.
Messages sent during this period
Here you can see the number of messages sent during a selected period. You can also find the number of messages sent during your chatbot's work below.
Messages received during this period
Here you can see the number of incoming messages for a selected period. The number of incoming messages for the entire period of your chatbot's work is also displayed below.
Costs spent during this period
Cost, an additional metric, is also available in WhatsApp chatbot statistics. It shows the amount of money spent on template messages.
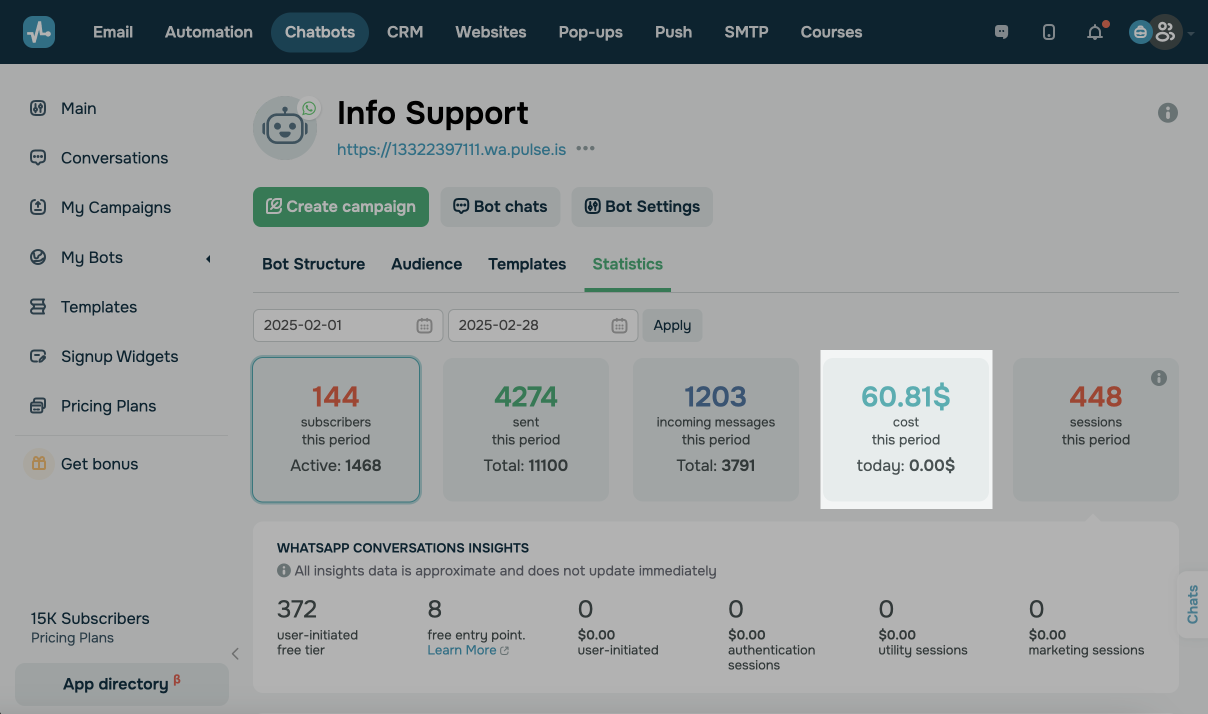
Costs spent on the current day are also displayed below.
The number of sessions during this period
Here you can see the number of users who interacted with your chatbot: clicked on buttons in messages, sent messages, and started or continued a flow. A session lasts for 24 hours from the moment a user first sends a message.
You can view detailed session statistics on your WhatsApp chatbot that shows the total number of sessions started, the number of sessions started after following an ad link, and the number of sessions initiated by users or business.
You can also view detailed message statistics in WhatsApp messaging insights under the main statistics. The data points are approximate and may not update immediately.
You can view the following WhatsApp messaging insights:
| User-initiated |
Shows service messages sent within a session that the user started. In most cases, these messages are free and can be sent during the 24-hour window. |
| Marketing templates |
Shows approved marketing templates sent through the standard Cloud API. Used for promotions, newsletters, and re-engagement. |
| Marketing templates lite | Shows marketing templates sent through the Marketing Messages Lite API, which optimizes deliverability and pricing for high-volume campaigns. |
| Utility templates | Shows approved utility templates, including order updates, account notifications, and payment reminders. |
| Authentication templates | Shows authentication templates, including one-time codes and two-factor authentication messages. |
| Free entry point |
Shows sessions started through a free entry point, including click-to-WhatsApp ads or Facebook and Instagram entry points. These 72-hour conversations are free and don't use your paid quota. |
Each counter shows the number of messages sent during the selected period and their cost in your account currency.
Last Updated: 22.06.2024
or