View site statistics
Analyze your website traffic data to measure its effectiveness using detailed graphs and key performance metrics.
In this article, we will talk about how to view website statistics.
General statistics
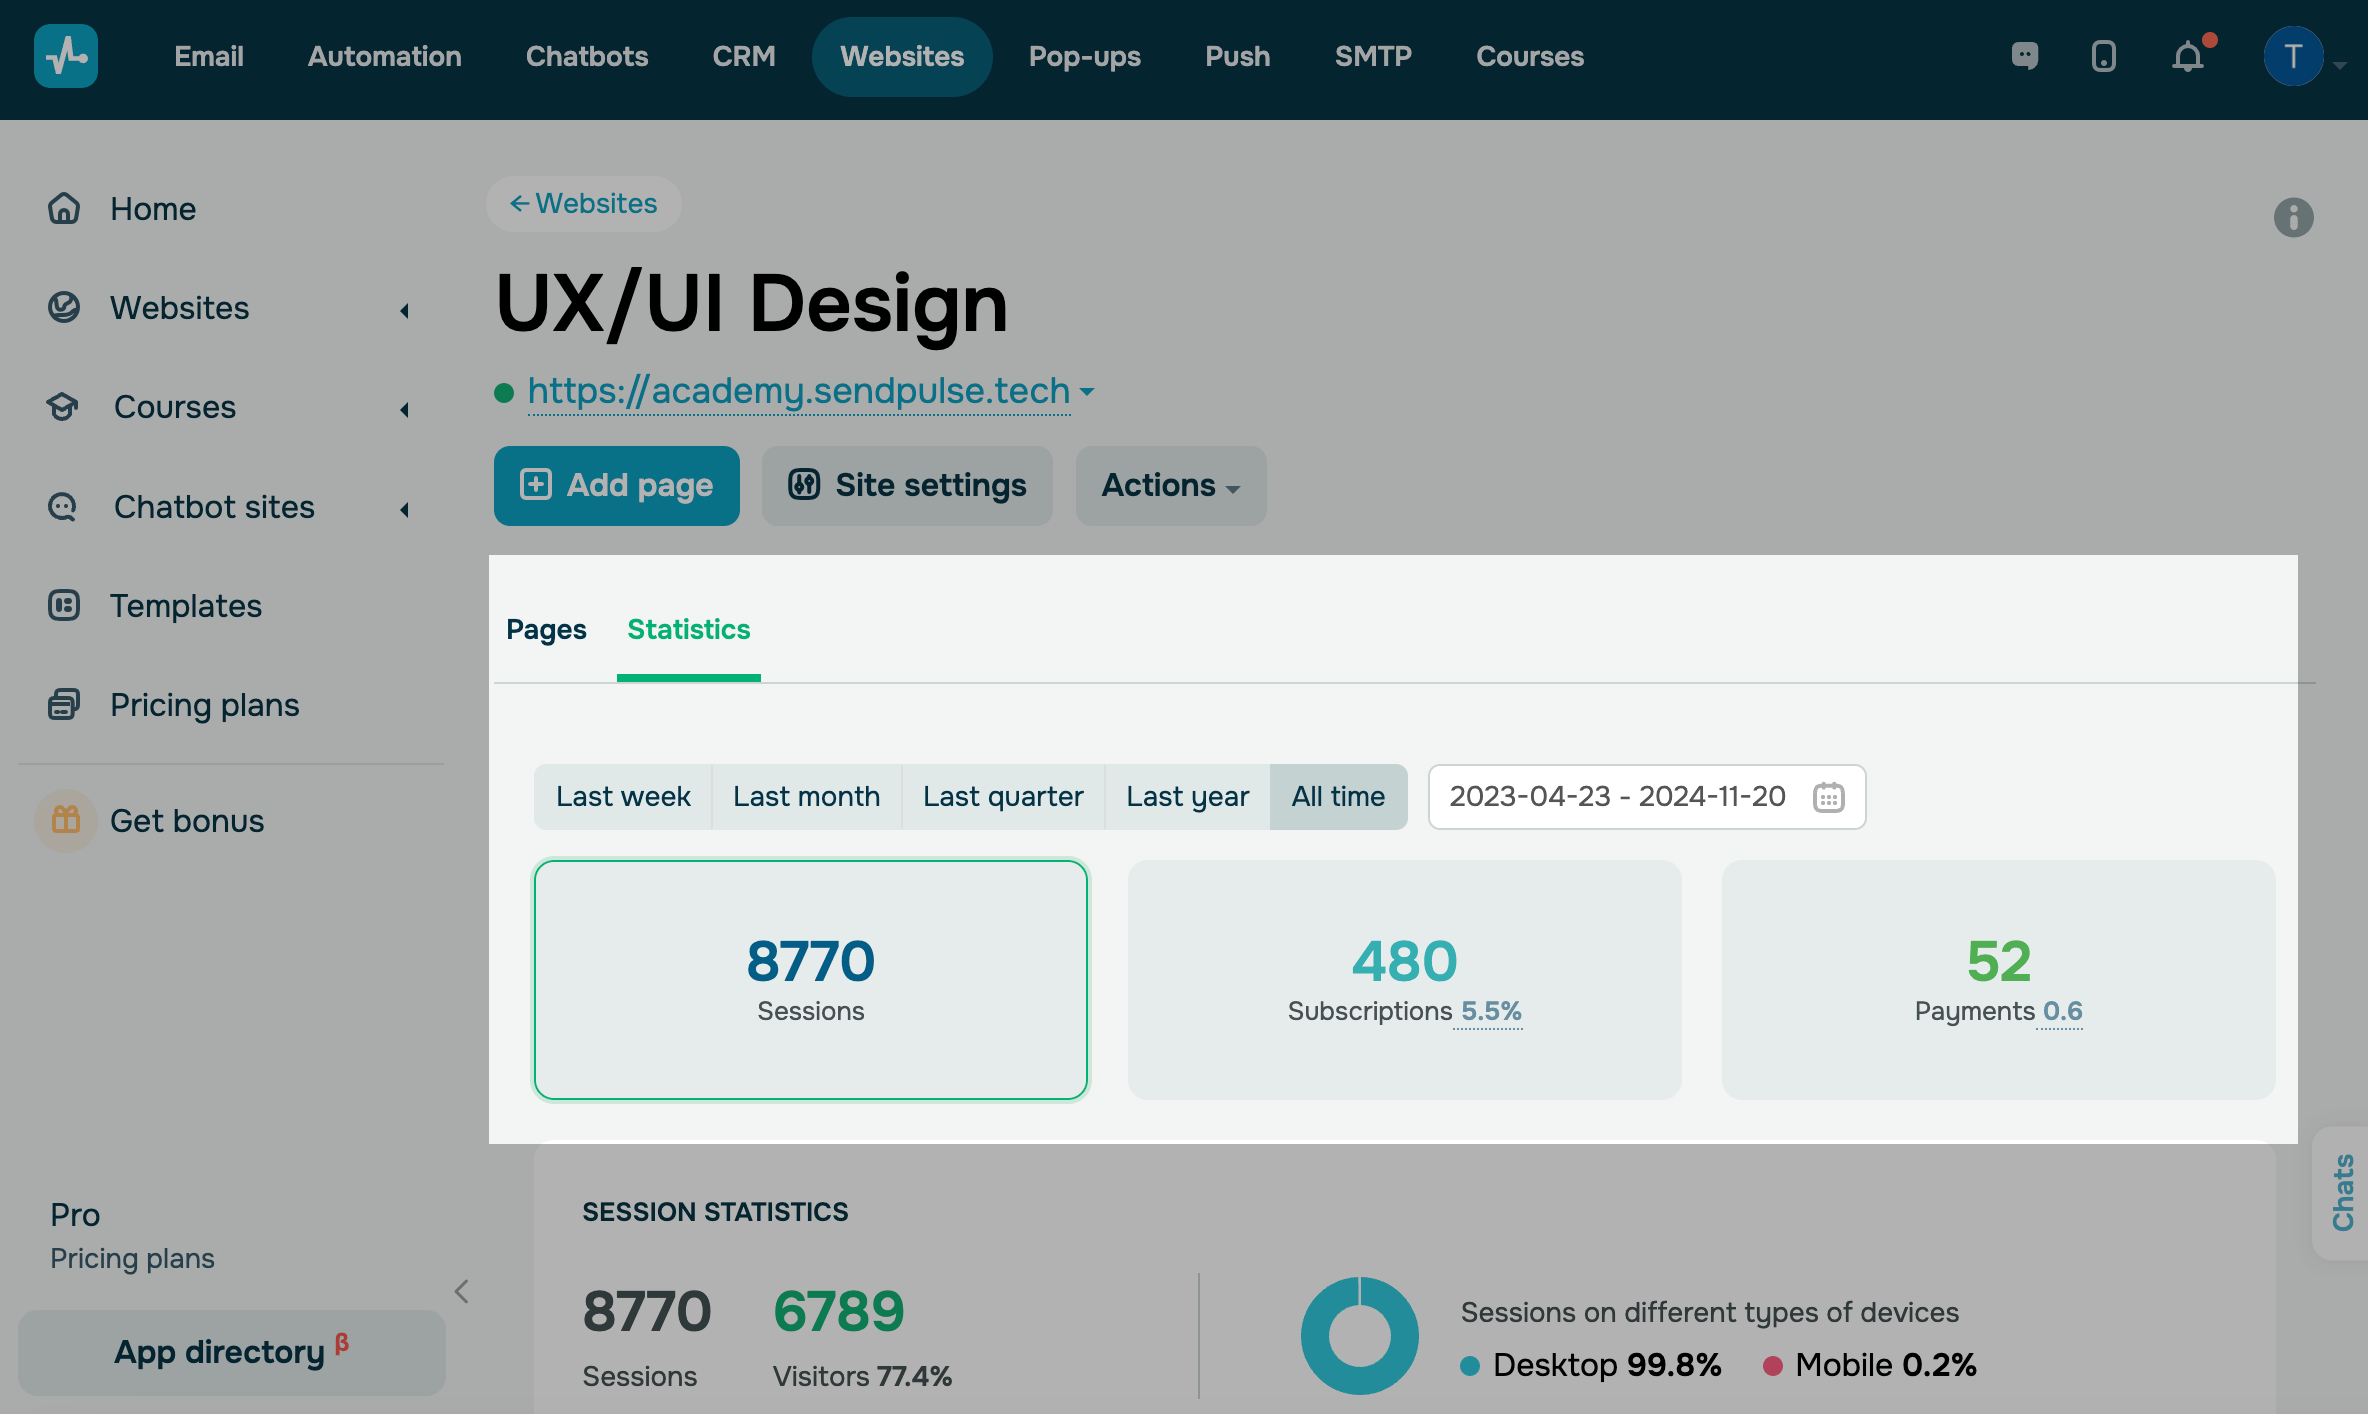
To view statistics, select your website and go to the Statistics tab.
You can view data from the last week, month, quarter, year, and all time or select custom dates.
Statistics include all pages of your website.
On the main page, view the number of sessions, subscriptions, and payments.
Sessions
A session is a user’s visit to your website that ends after a 30-minute idleness.
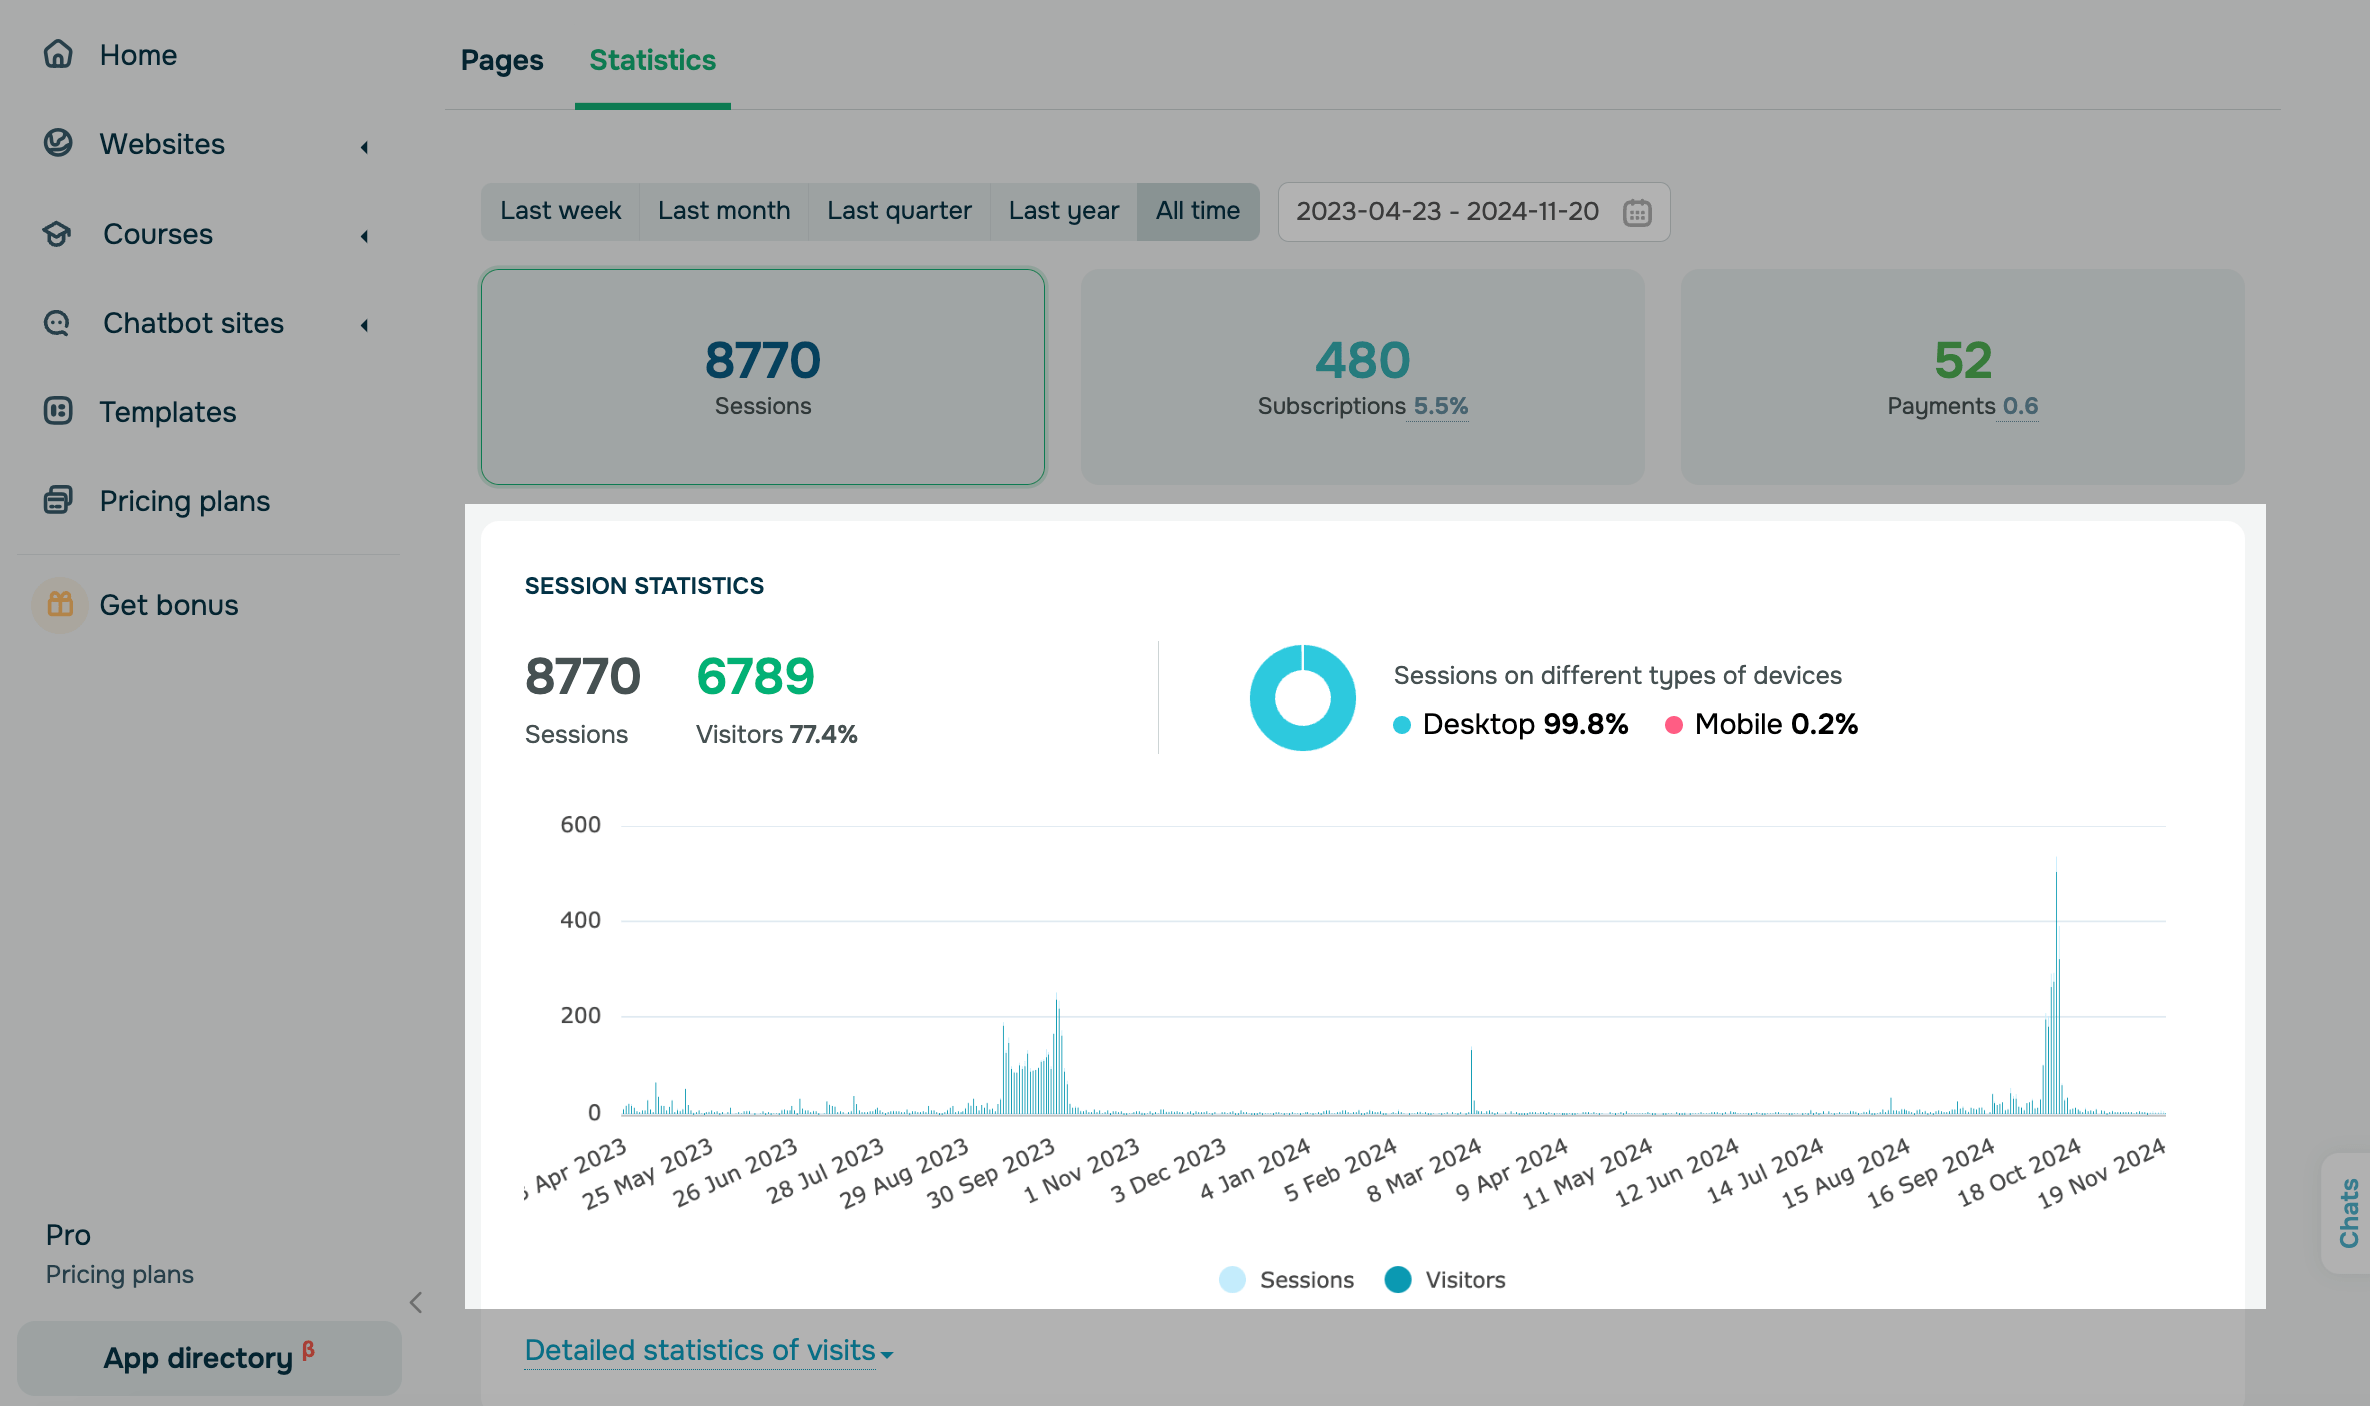
Click the Sessions block to view the total number of sessions and visitors from the selected period.
| Sessions | The number of times a user visits your page. A single user can visit your page multiple times. Sessions end after a 30-minute idleness. |
| Visitors | The number of unique visitors and visitor-to-session ratio. |
On the right side of the graph, you can see the percentage of visitors using desktop and mobile devices.
SendPulse has tracked mobile user data since November 2024, so all visits before that count as desktop.
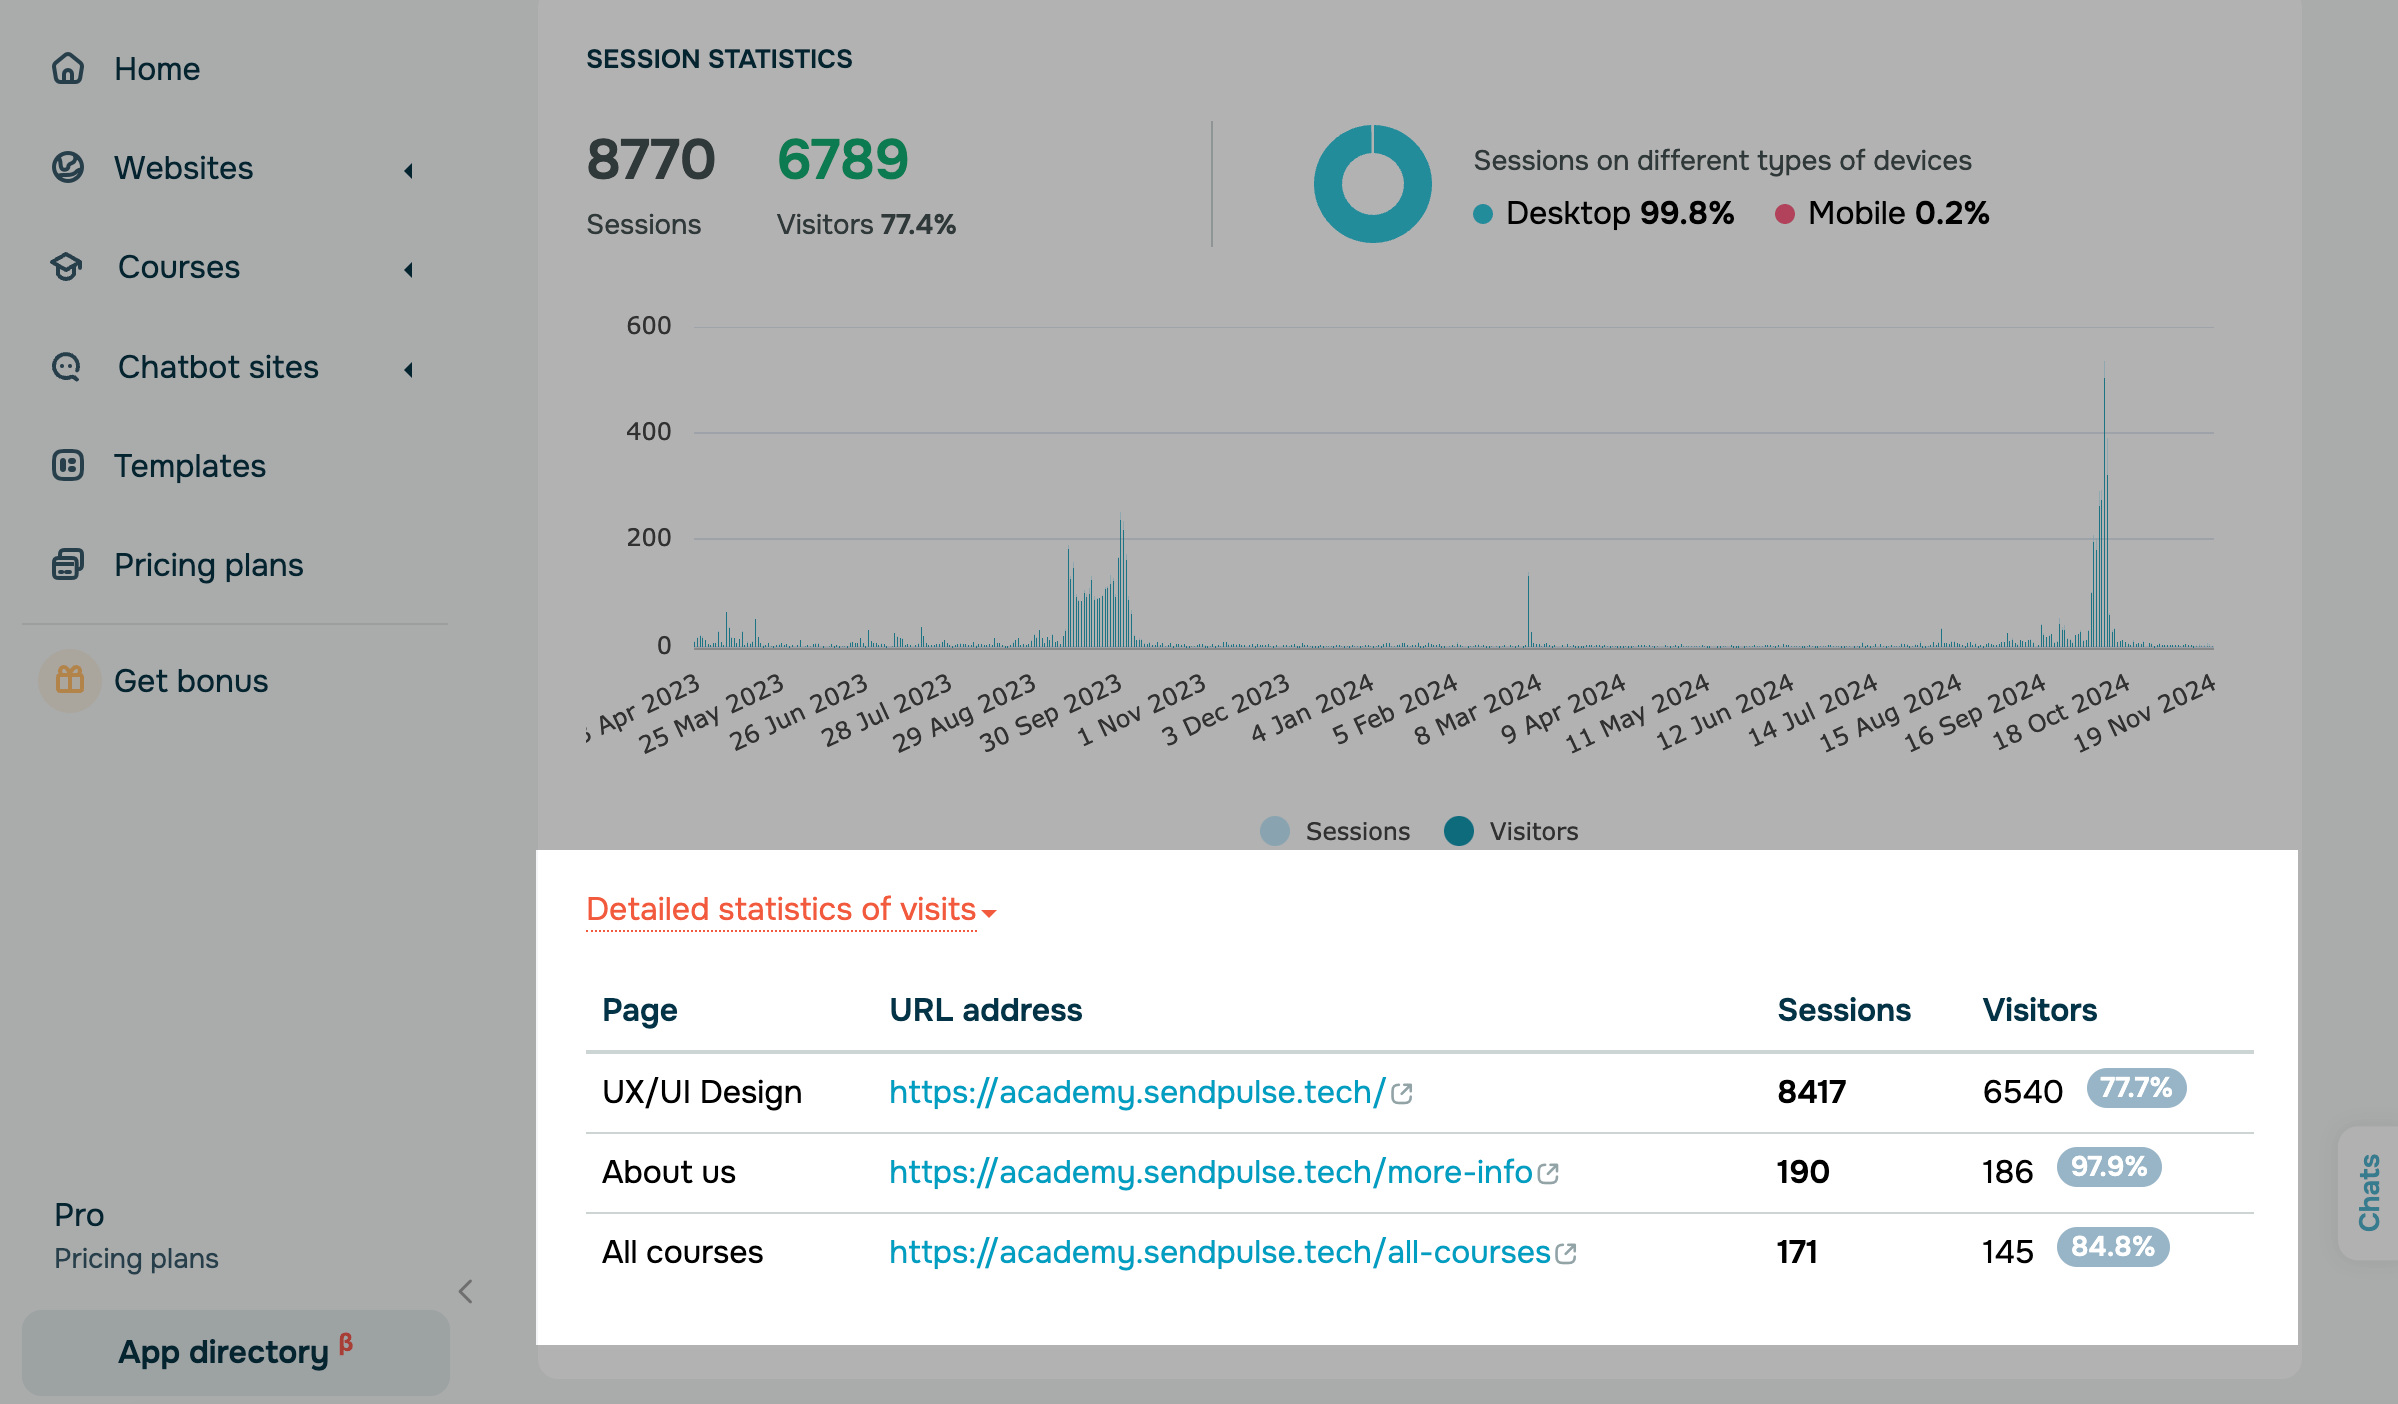
To view page visit statistics, click Detailed statistics of visits. The table shows visited pages, their links, and the number of sessions and visitors.
Subscriptions
A subscription retrieves a visitor’s contact data using the Form widget.
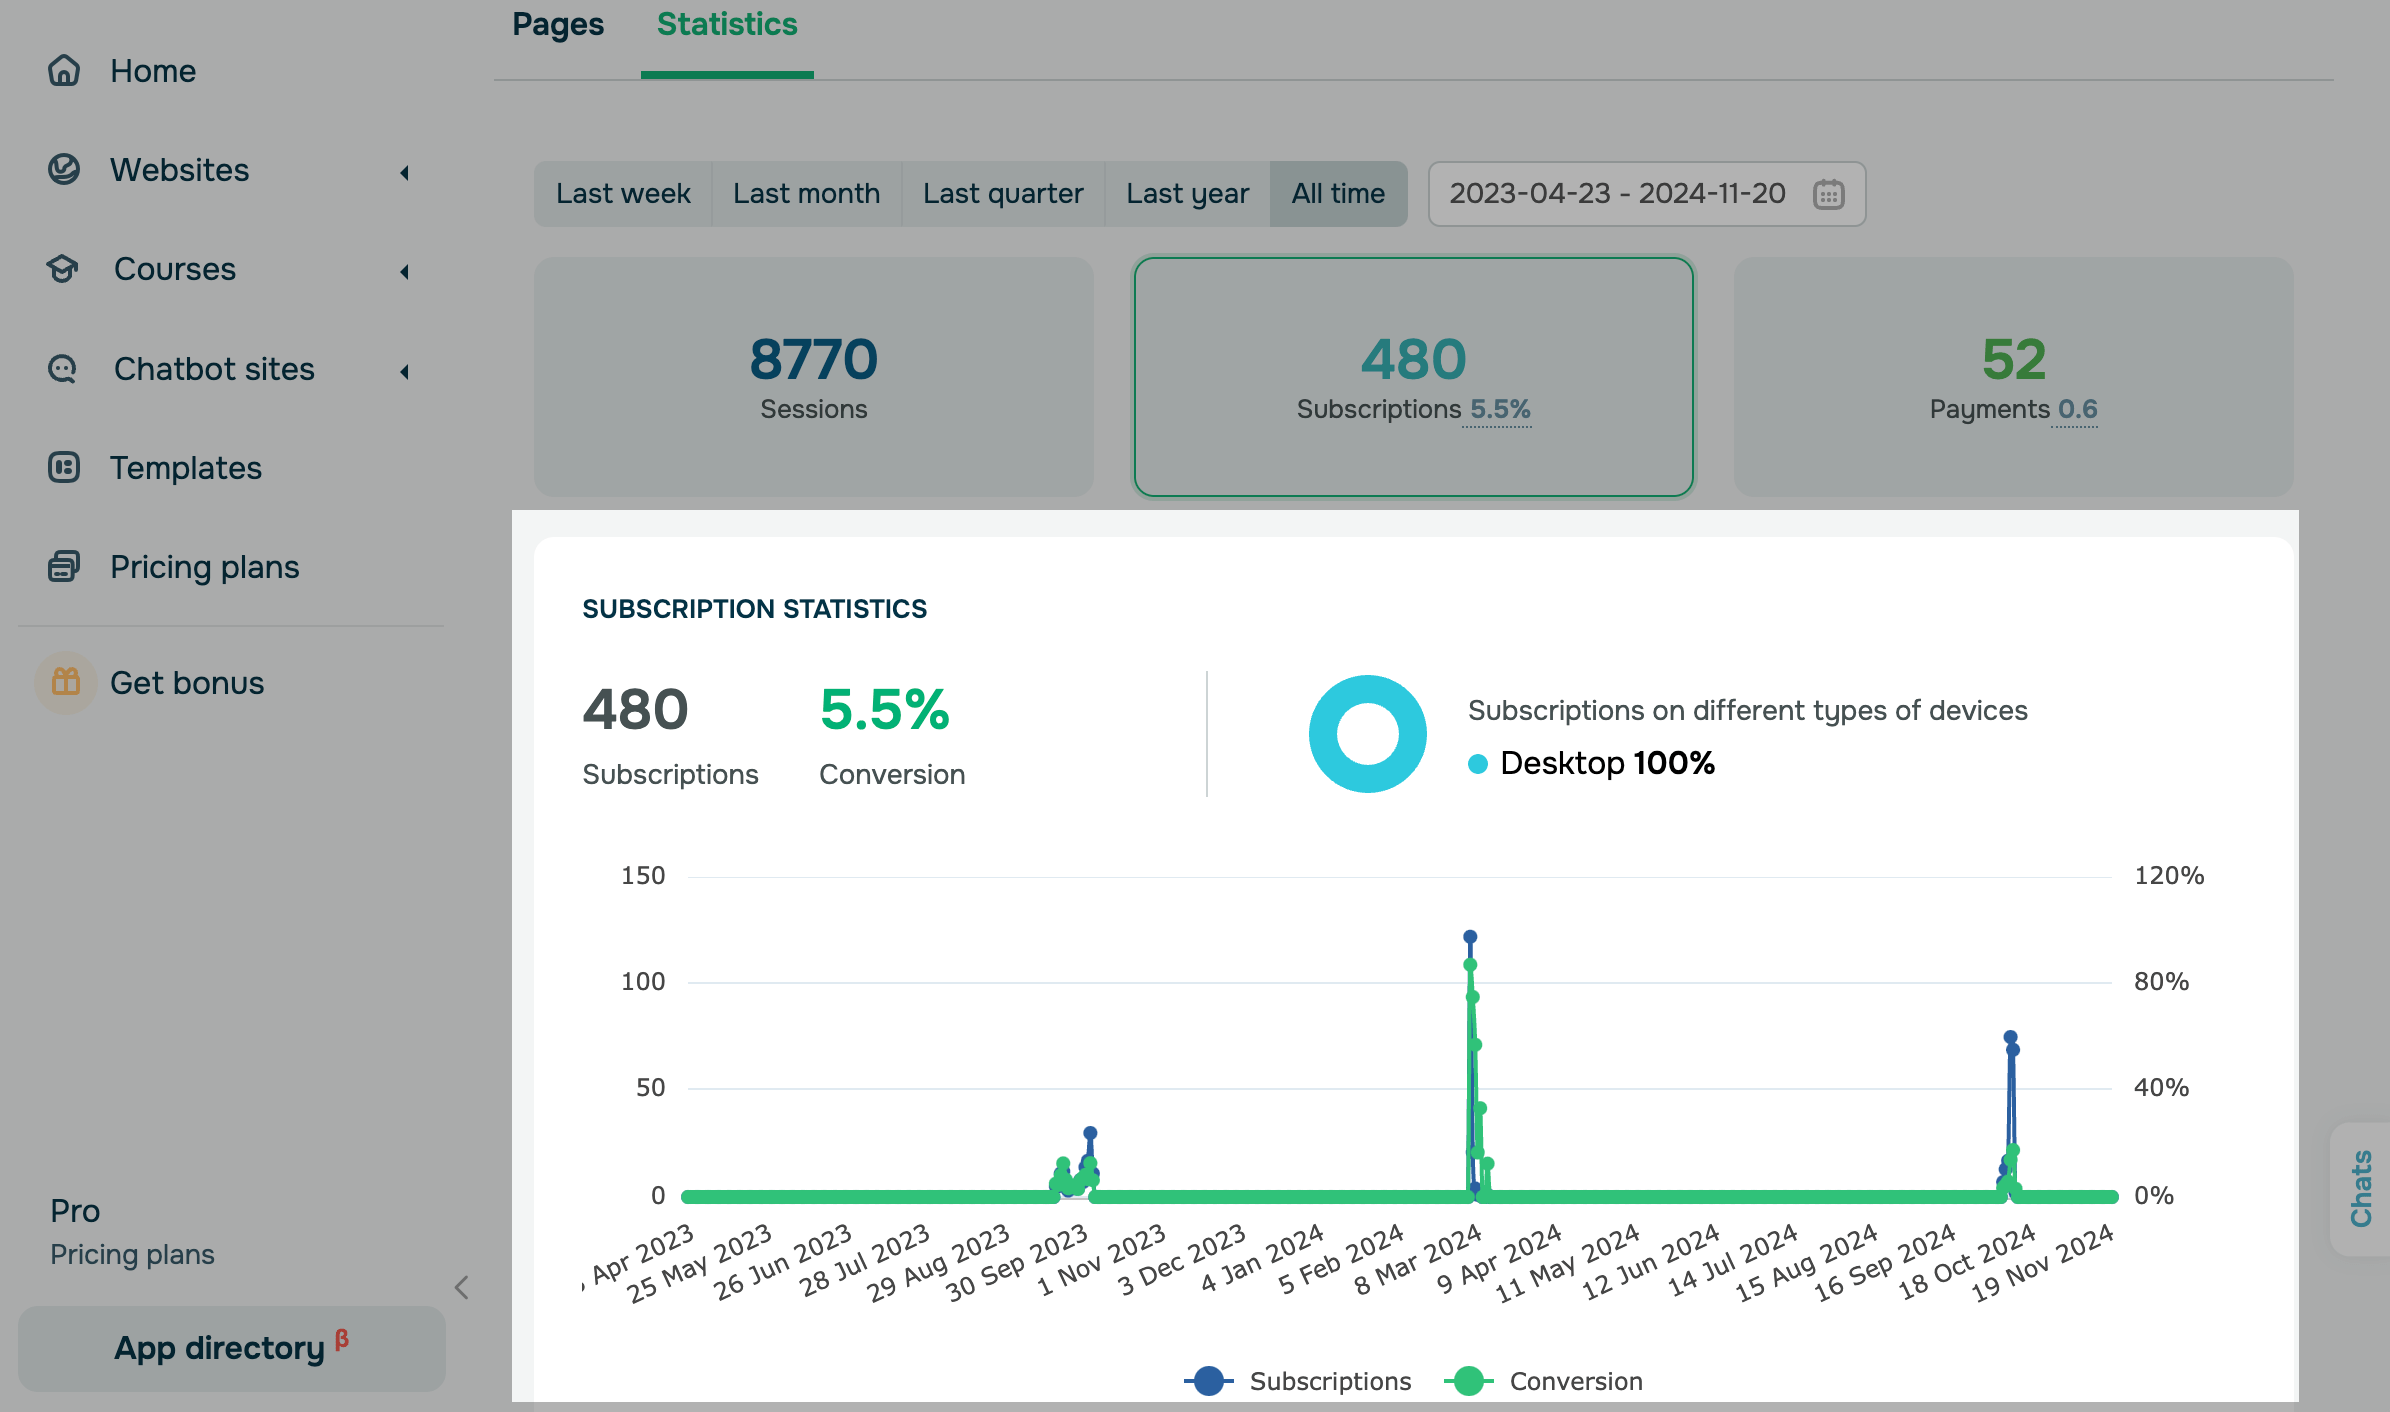
Click the Subscriptions block to view your subscription and conversion statistics.
| Subscriptions | The number of subscriptions via the Form widget. |
| Conversions | The subscription-to-session ratio. |
On the right side of the graph, you can see the percentage of subscribers using desktop and mobile devices.
SendPulse has tracked mobile user data since November 2024, so all visits before that count as desktop.
You can also view detailed subscription statistics for every website form. Statistics include all your website pages and show the number of subscriptions made on them.

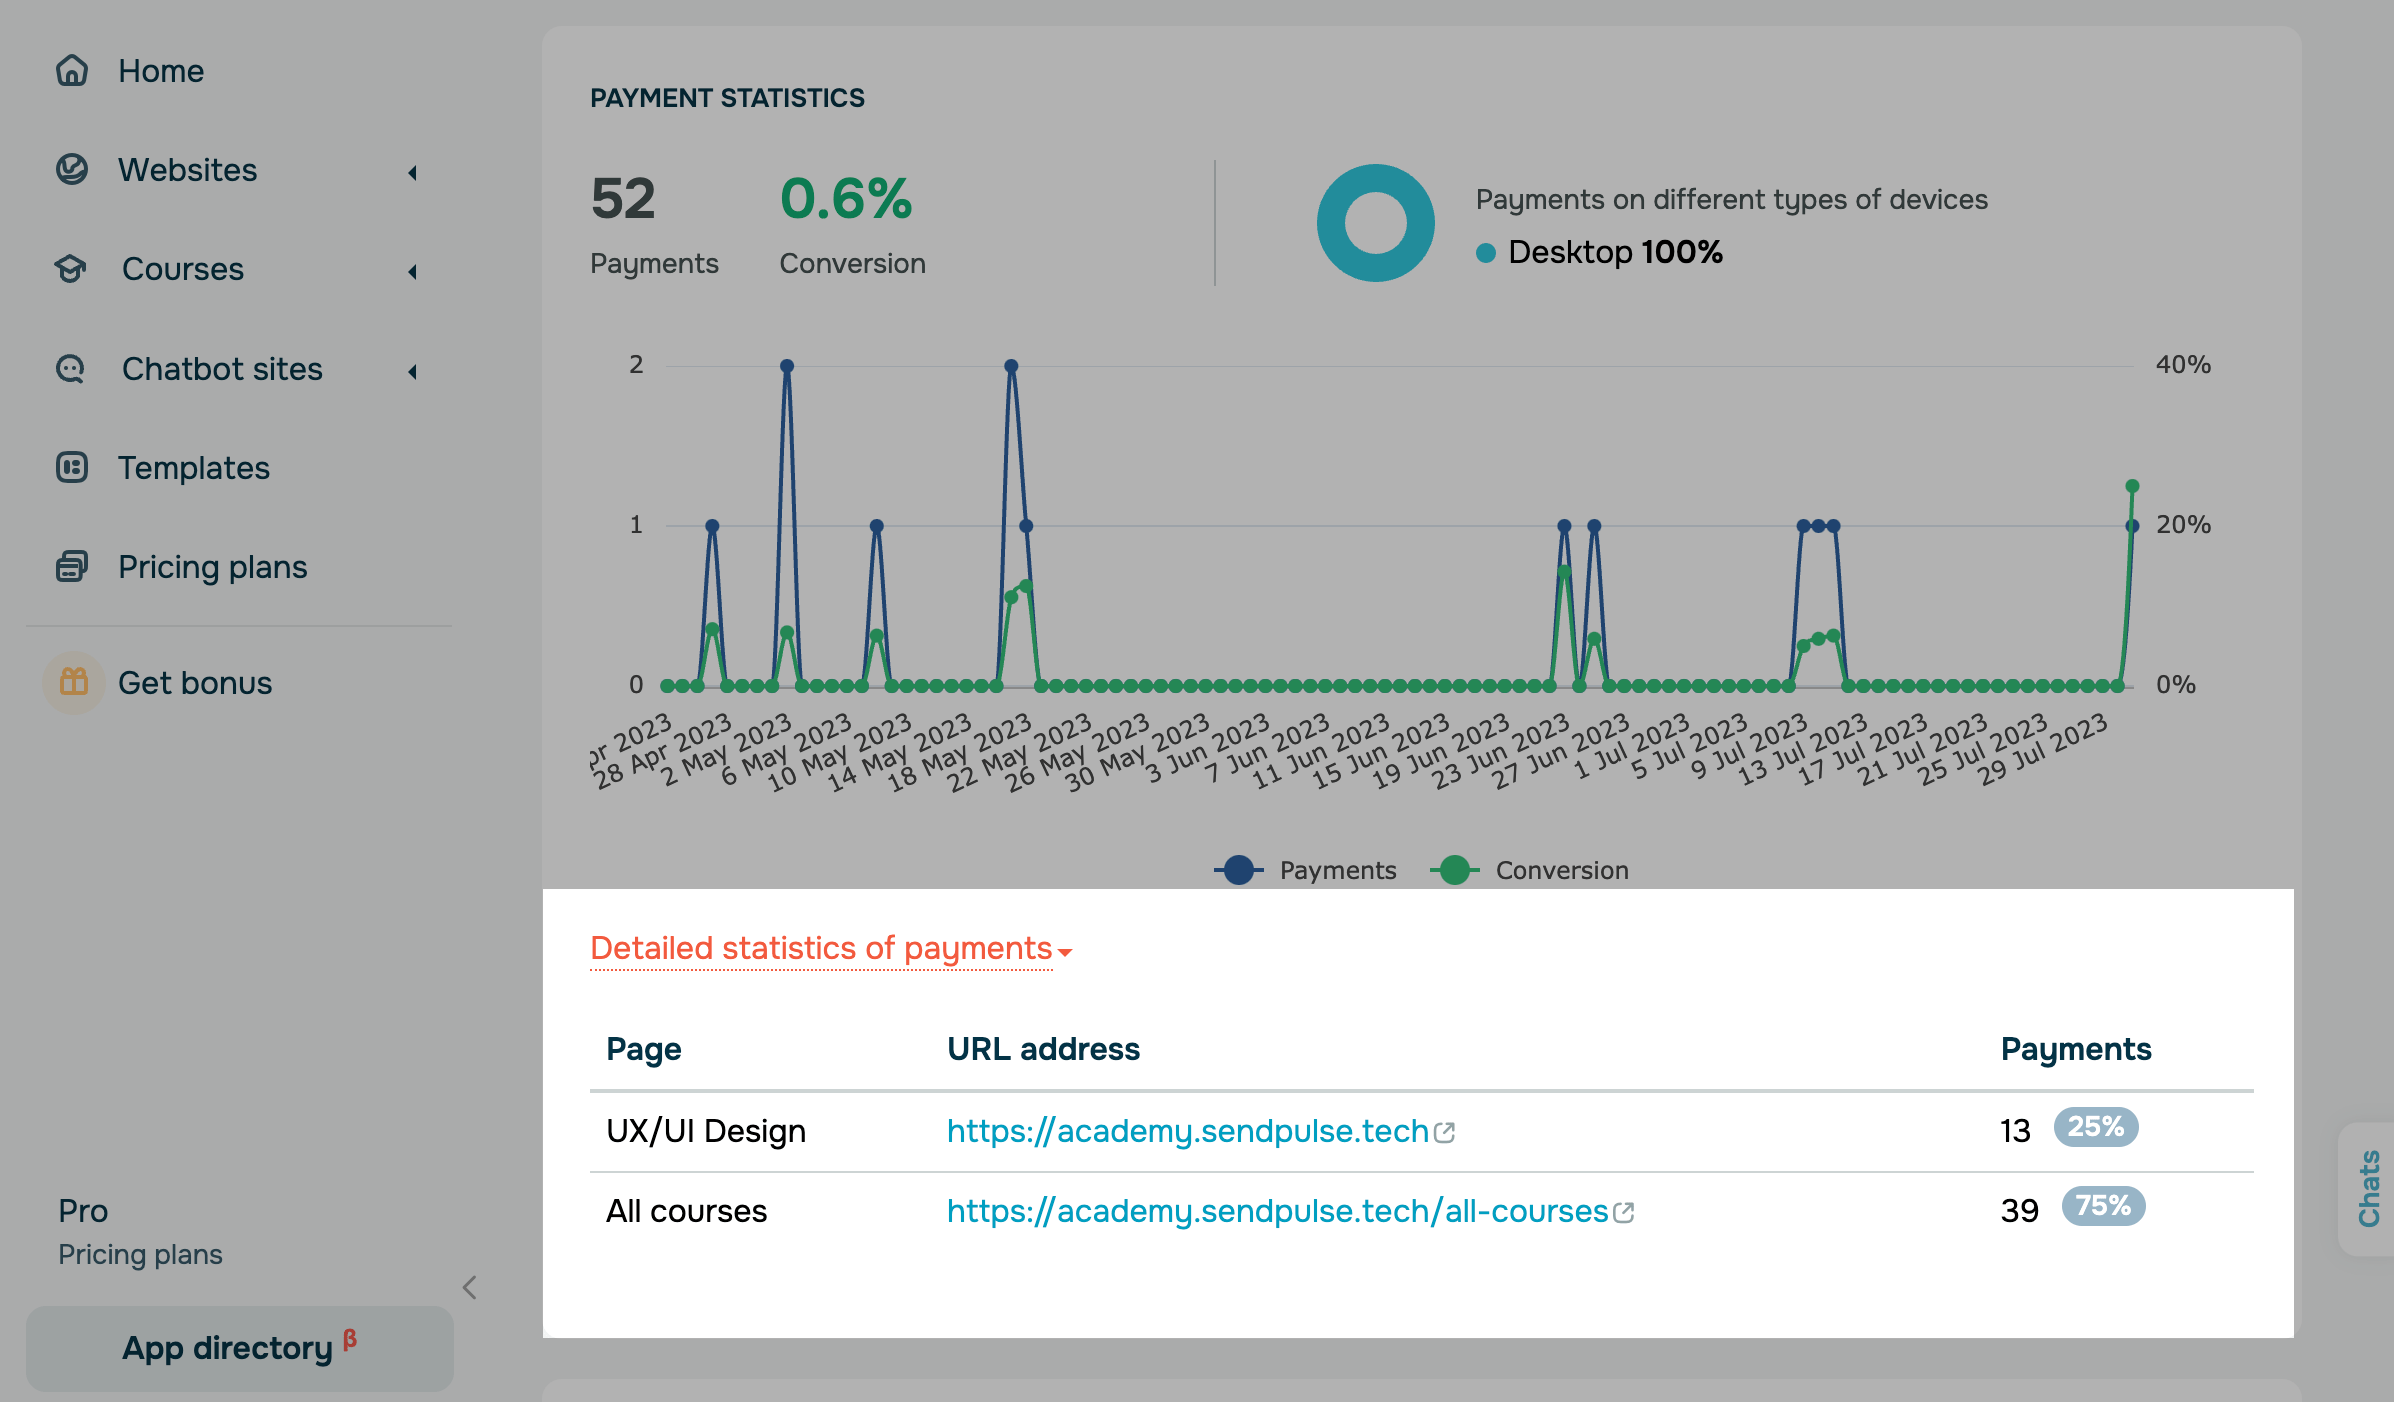
Payments
A payment is a successful transaction a visitor makes via the Payment element.
Click the Payments block to view transaction data from the selected period.
| Payments | The number of successful transactions on a page or website. |
| Conversions | The payment-to-session ratio. |
On the right side of the graph, you can see the percentage of successful payments made using desktop and mobile devices.
SendPulse has tracked mobile user data since November 2024, so all visits before that count as desktop.

You can also view detailed payment statistics for every website payment form. Statistics include all your website pages and show the number of transactions in total and as percentages.
Traffic sources
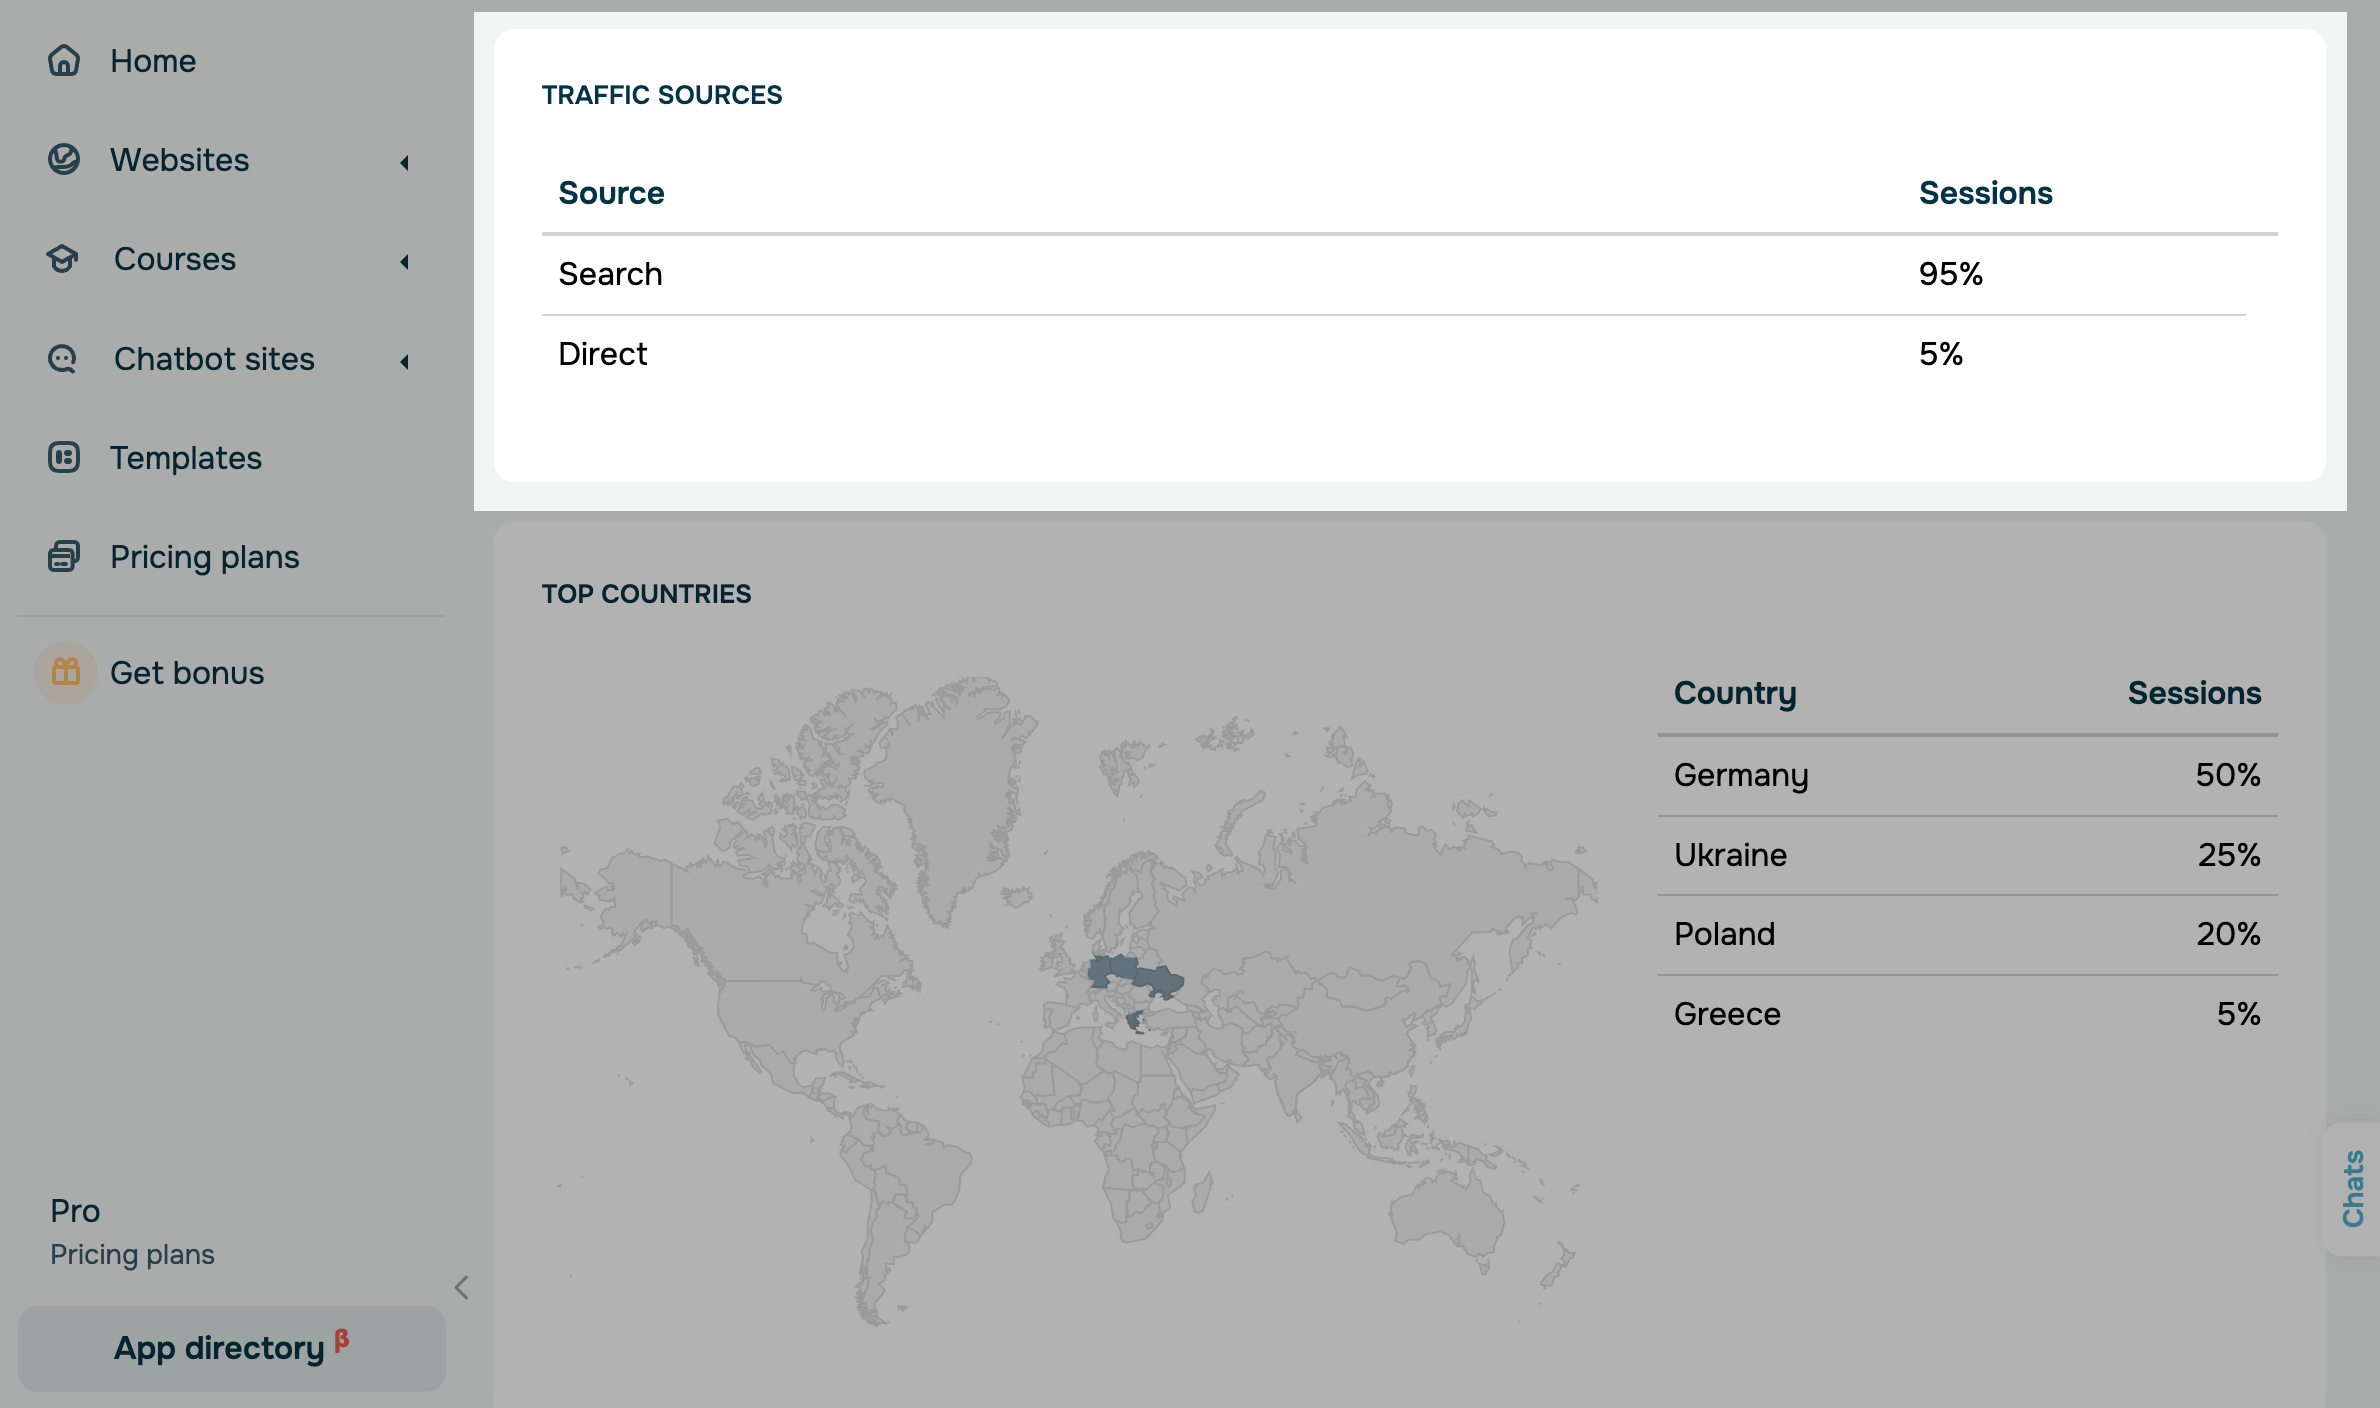
To view traffic sources for the selected period, go to the Traffic sources section.
Here, you will find a list of sources and the percentage of visitors, conversions, or payments based on the selected tab.
You can view the following traffic source categories:
| Direct | Visitors who access your website by typing the URL into their browser's address bar or clicking a saved bookmark. This group often includes repeat customers and people who visit your website intentionally. |
| Search | Visitors who access your website through search engines (such as Google or Bing) by typing in specific queries. |
| Referral | Visitors who access your website through links on other websites. These could include affiliate links, articles, forums, or blogs where your website is mentioned. |
| Social | Visitors who access your website through social media platforms such as Facebook, Instagram, and others. |
| Advertising | Visitors who access your website through paid advertising, including banners, targeted or contextual ads, and other promotional campaigns. |
| Messengers | Visitors who access your website through messaging apps such as WhatsApp, Telegram, Viber, Messenger, and similar platforms. This traffic may come through sent links, campaigns, or personal messages. |
| Visitors who access your website through links in email campaigns, including promotional emails, order confirmations, and more. | |
| Other | Visitors who do not fall under any of the categories above. This may include unconventional sources, such as automation systems integrated with your website. |
Visitor country
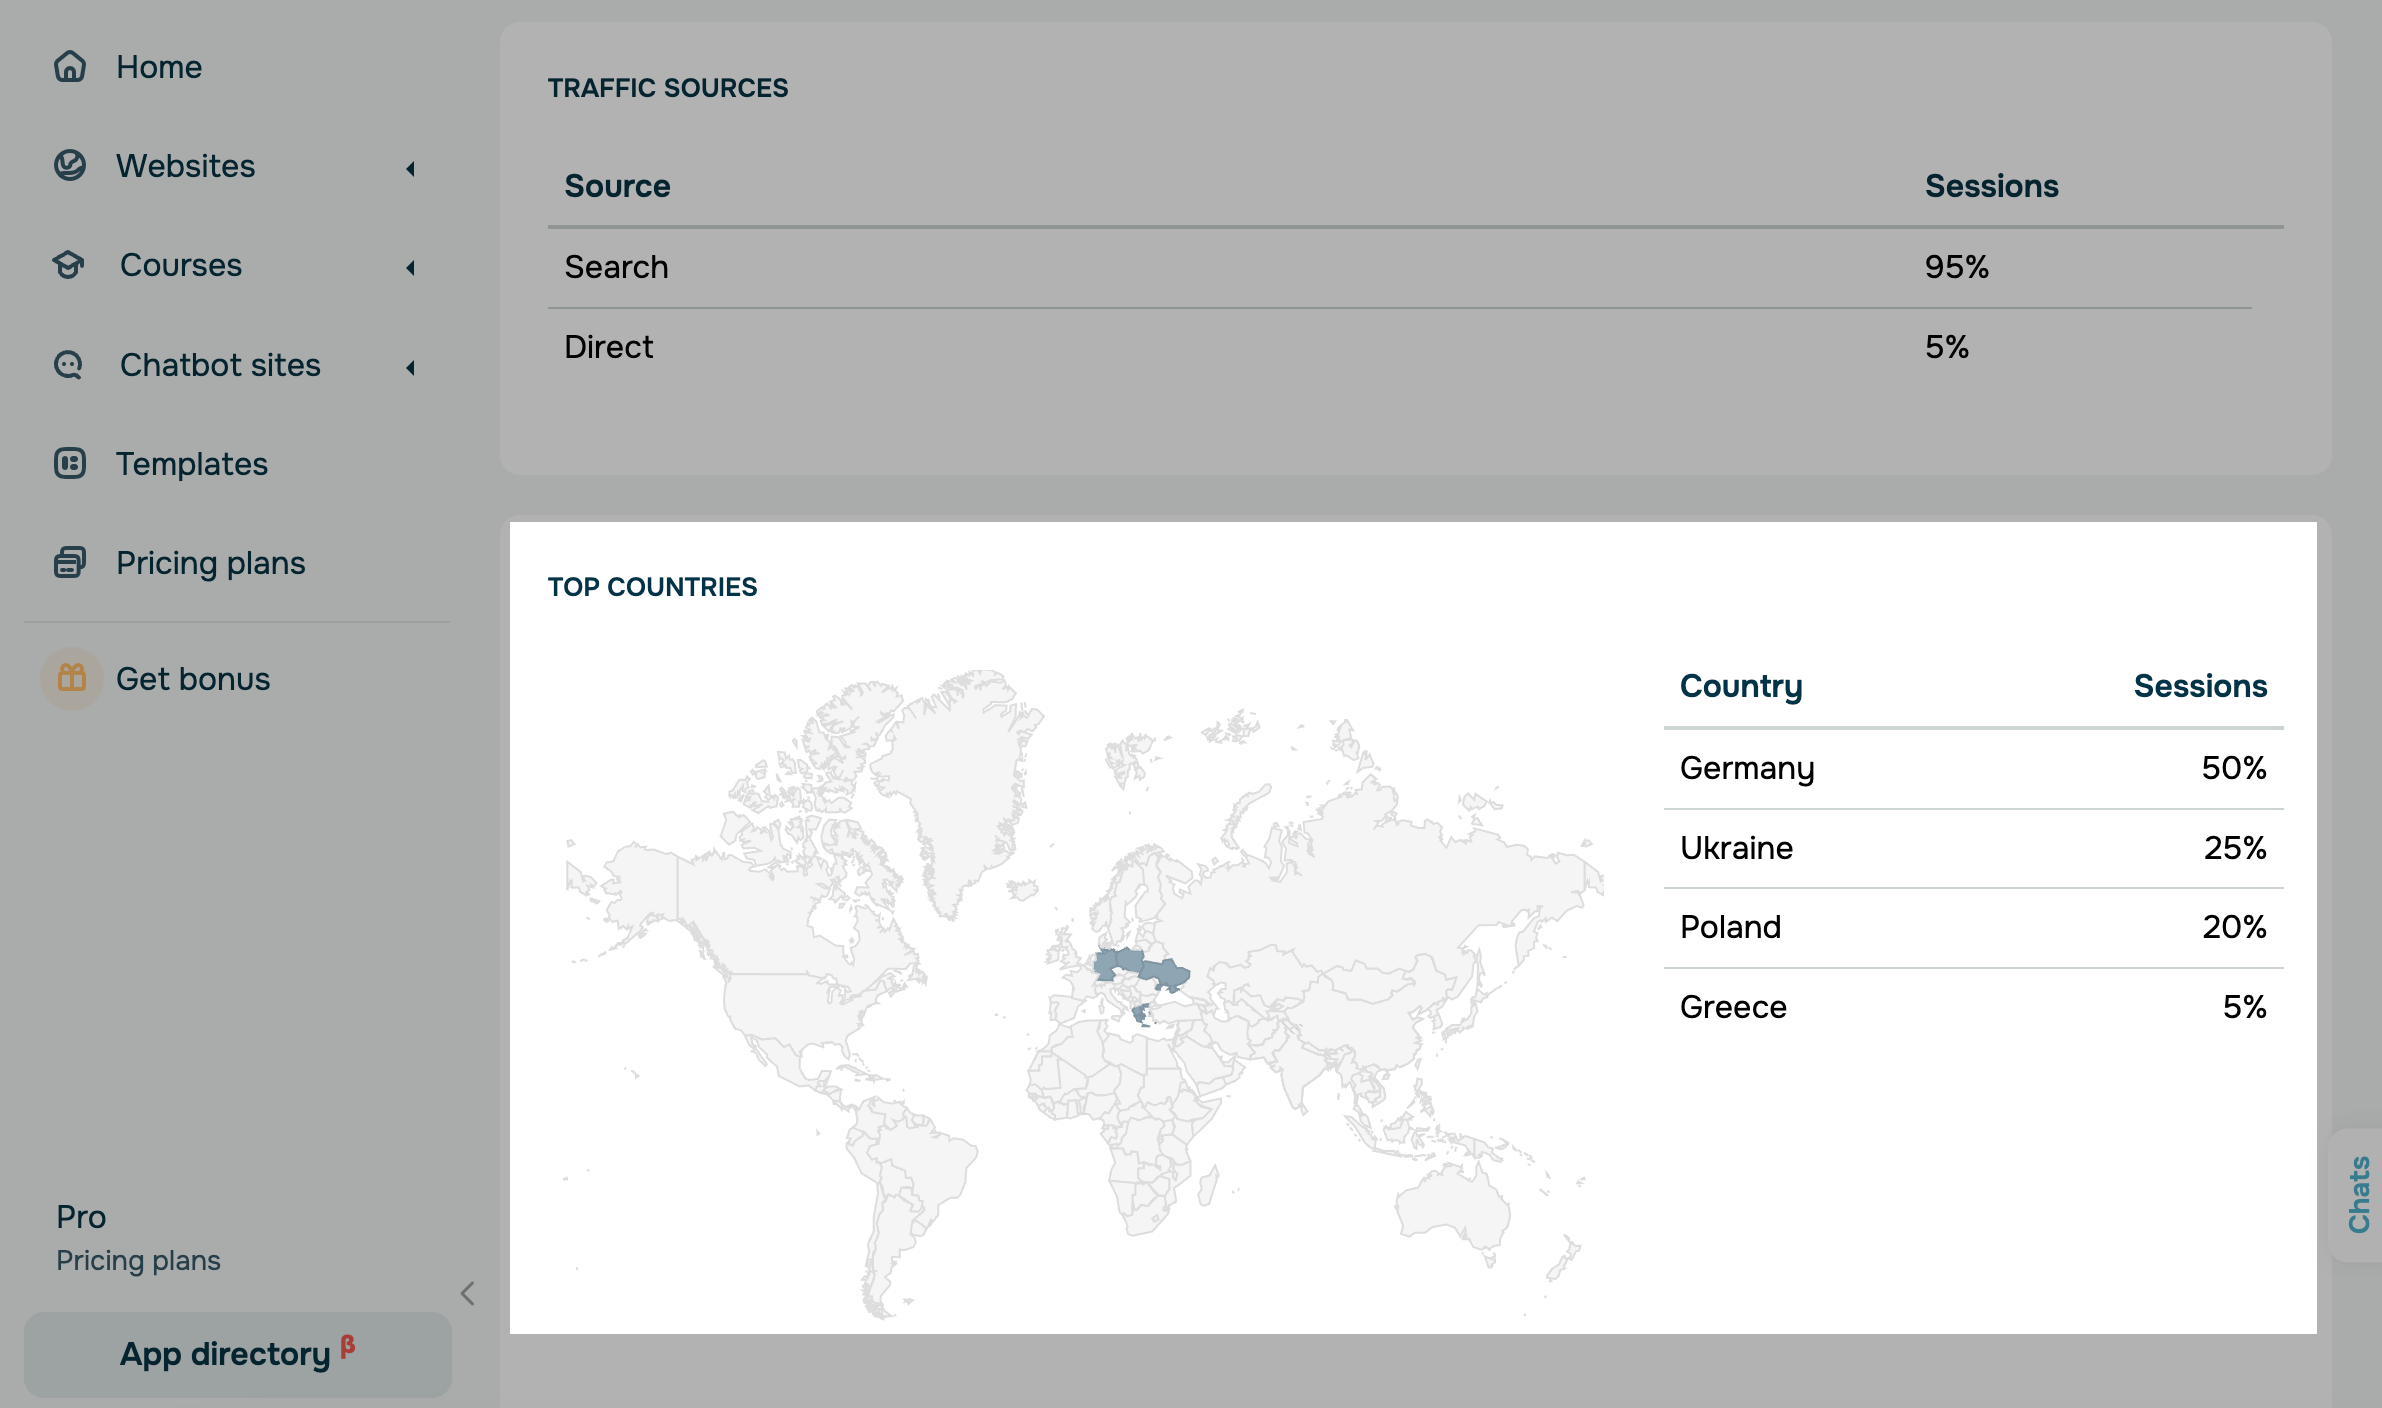
Scroll down to the bottom of the page to view your visitors' countries from the selected period.
You can view the list of countries and the percentage of sessions.
You can also use Google Analytics or Facebook Pixel to retrieve more data about your page activity.
Last Updated: 10.01.2025
or