Export email campaign data
Use export options to download detailed email campaign data from different report sections.
For example, you can export data to review performance across multiple campaigns, download recipient-level data for a specific campaign, or save statistics by locations, clicks, and errors for further analysis or reporting.
Let’s talk about how to export different types of campaign data.
Export the list of reports
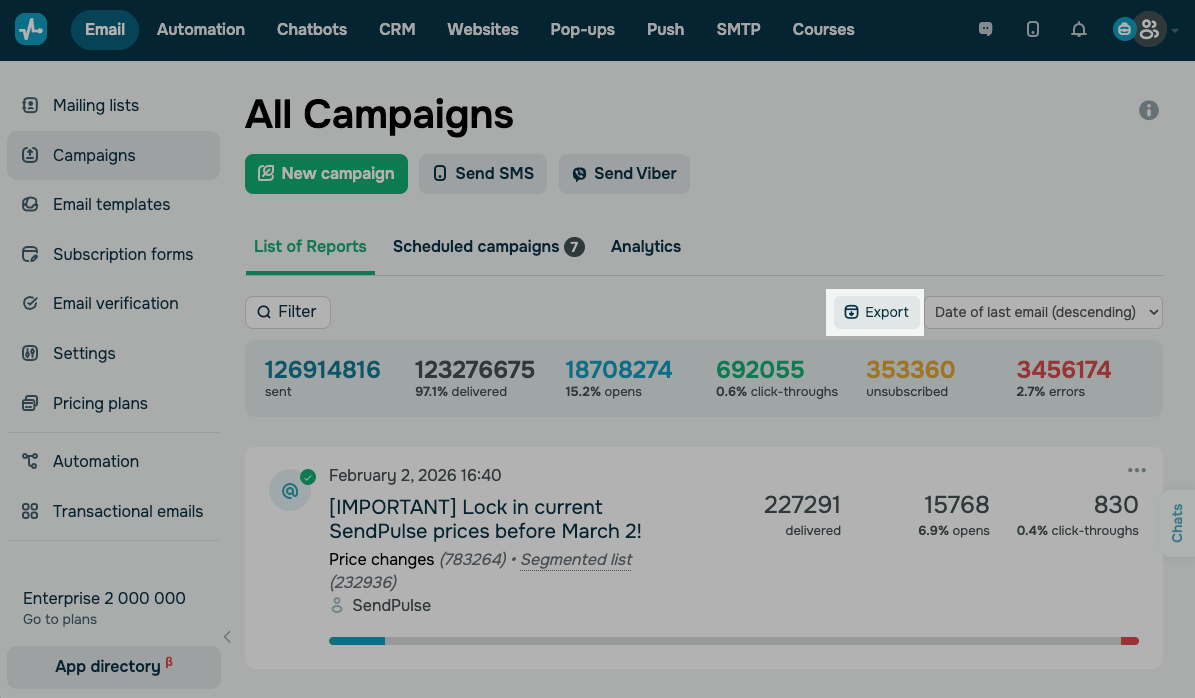
Exporting campaign history creates a file with one row per campaign. It shows campaign details, such as name, type, date sent, mailing list, and UTM tags. The file also includes performance metrics, such as the number of emails sent, delivered, opened, and clicked, as well as errors, unsubscribes, and spam complaints.
You can export campaign history to compare engagement and delivery trends across campaigns, or to build a report in Excel or Google Sheets.
Go to Email > Campaigns. Open the List of reports tab.
Use Filter to narrow the list by product, campaign name, mailing list, phone number, or email address, and apply the filter. Click Export. Select a data format, such as CSV, XLS, or XLSX. Confirm the export.
Export the list of recipients
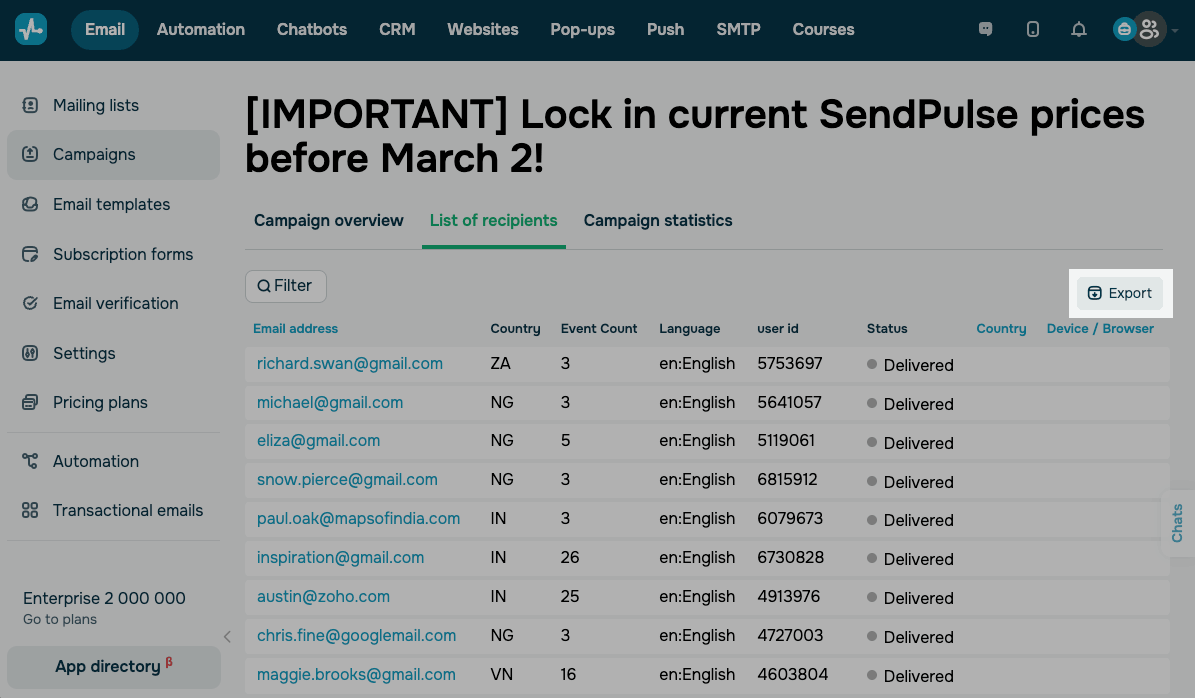
Exporting the list of recipients creates a delivery report for a specific campaign. The report includes subscriber-level fields such as email address, send/open/redirect dates, delivery status, location, and device details.
You can apply a filter to export recipients with a specific delivery status, such as Delivered, and see who received your email.
Go to Email > Campaigns and open your campaign. Navigate to the List of recipients tab.
Use Filter to narrow the list by status, country, region, domain, or email address, and apply the filter. Click Export and select a file format, such as CSV, XLS, or XLSX. Confirm the export.
Campaign statistics
You can export data from multiple tabs, including Campaign statistics, Opens by location, Clicks map, and Error statistics.
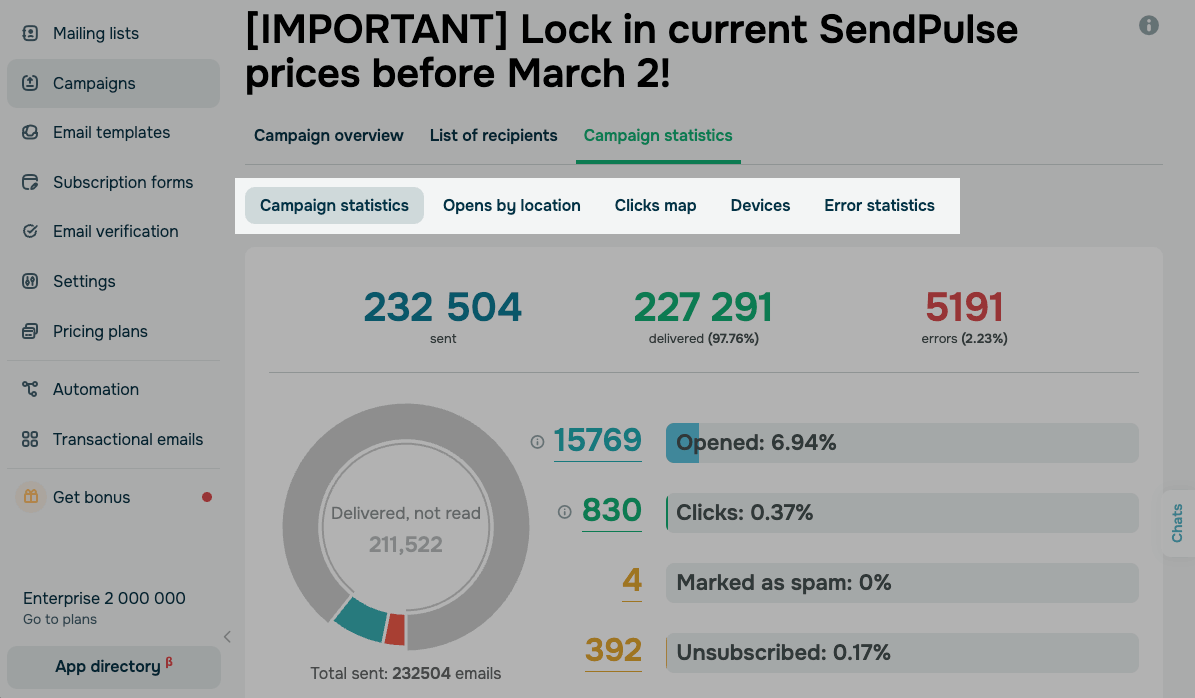
Export campaign statistics
This report includes key performance charts, including sent/delivered/errors, engagement metrics, and subscriber activity.
You can export a PDF file to share a visual summary or a CSV file if you need numeric data for calculations.
Go to the Campaign statistics tab. Scroll to Export data. Select a data format, such as PDF or CSV.
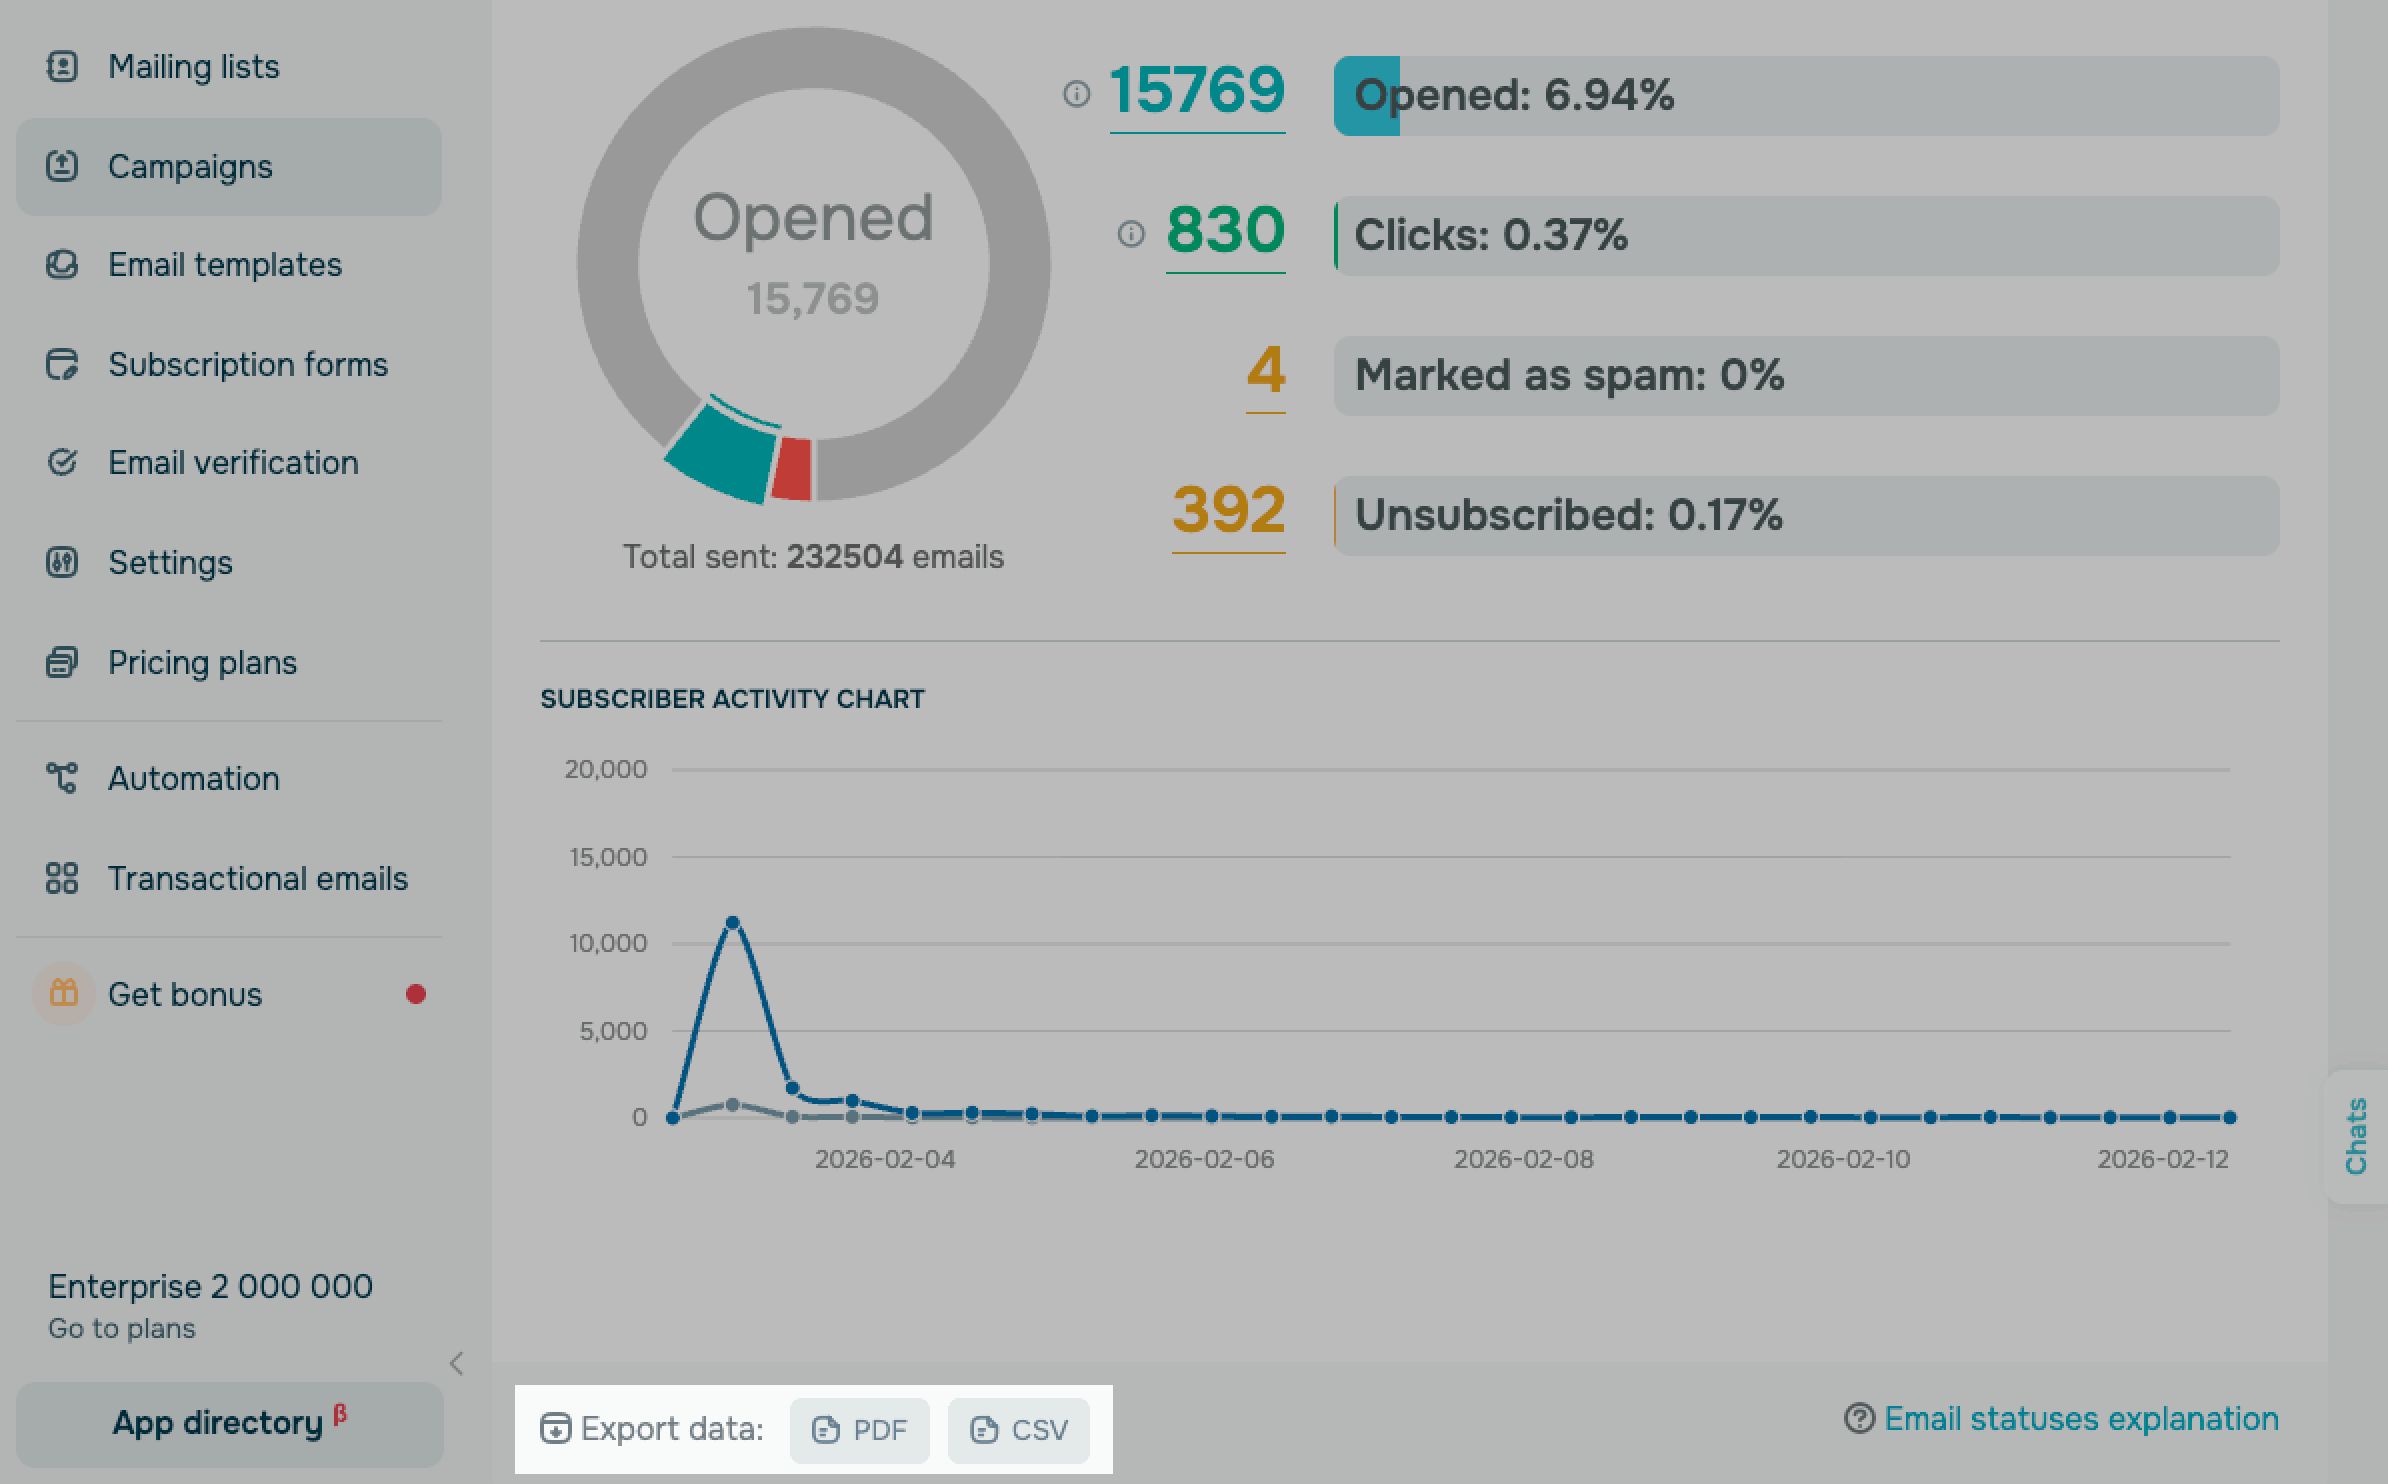
The report includes data from the following charts:
| Campaign statistics | The number of sent and delivered emails and errors. |
| Delivery statistics | The number and percentage of emails opened, links clicked, spam complaints, and unsubscribes. |
| Subscriber activity chart | The time when users opened and interacted with emails. |
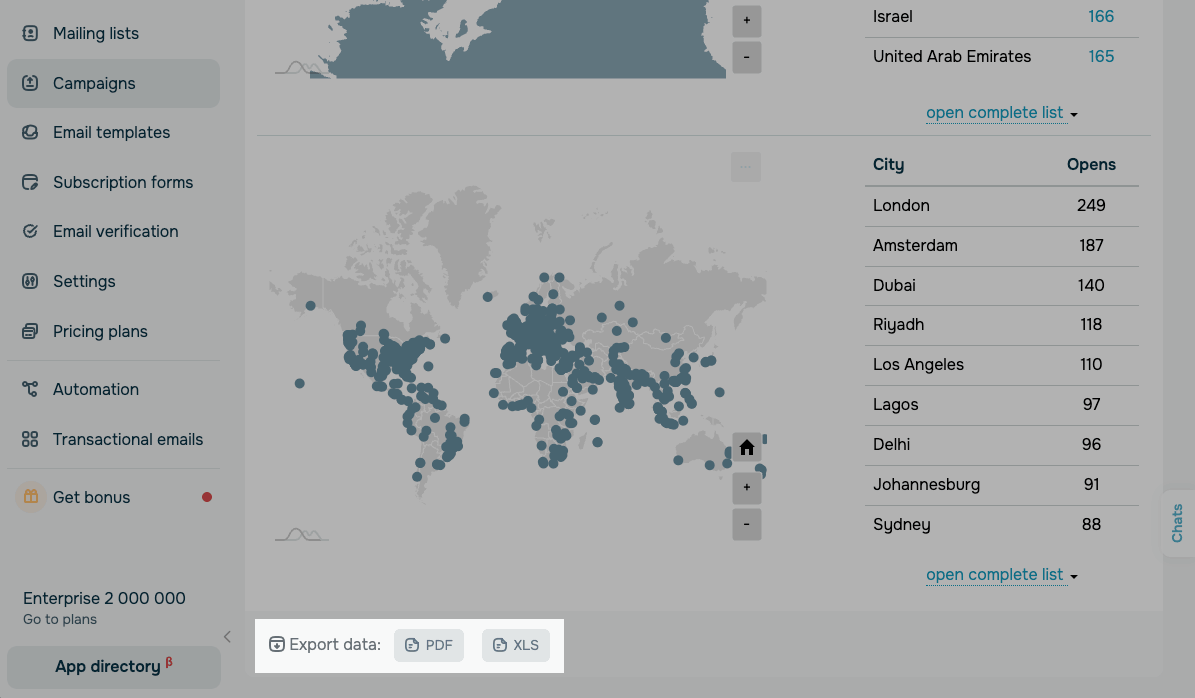
Export location statistics
This report includes a regional breakdown of email opens. It can show entries like Not detected when location data points are unavailable.
You can export this report to see which countries and cities generate the most engagement, schedule your campaigns by time zone, or segment your audience for localized follow-ups.
Go to the Opens by location tab. Scroll to Export data. Select a data format, such as PDF or XLS.
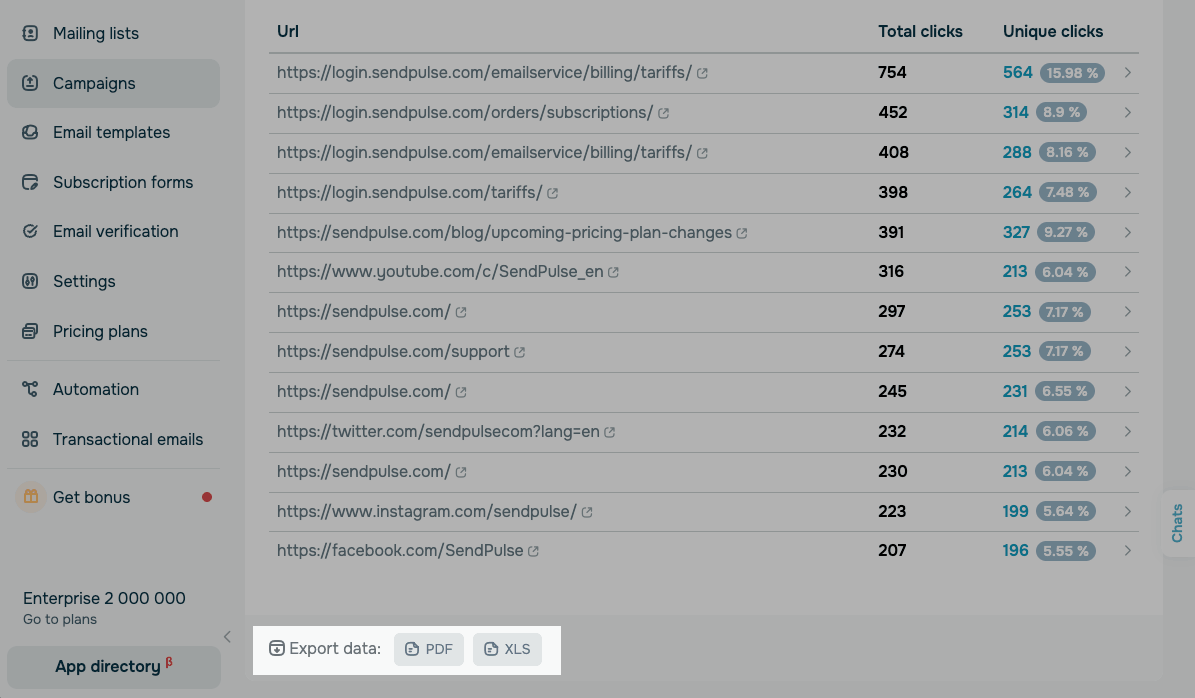
Export click-through statistics
This report shows link performance. The file includes a list of tracked URLs and click-through counts.
You can export this report to see which calls to action perform best and which links need a better placement or copy.
Go to the Clicks map tab. Scroll to Export data. Select a data format, such as PDF or XLS.
The Clicks map tab shows data only after a recipient clicks a link in your campaign.
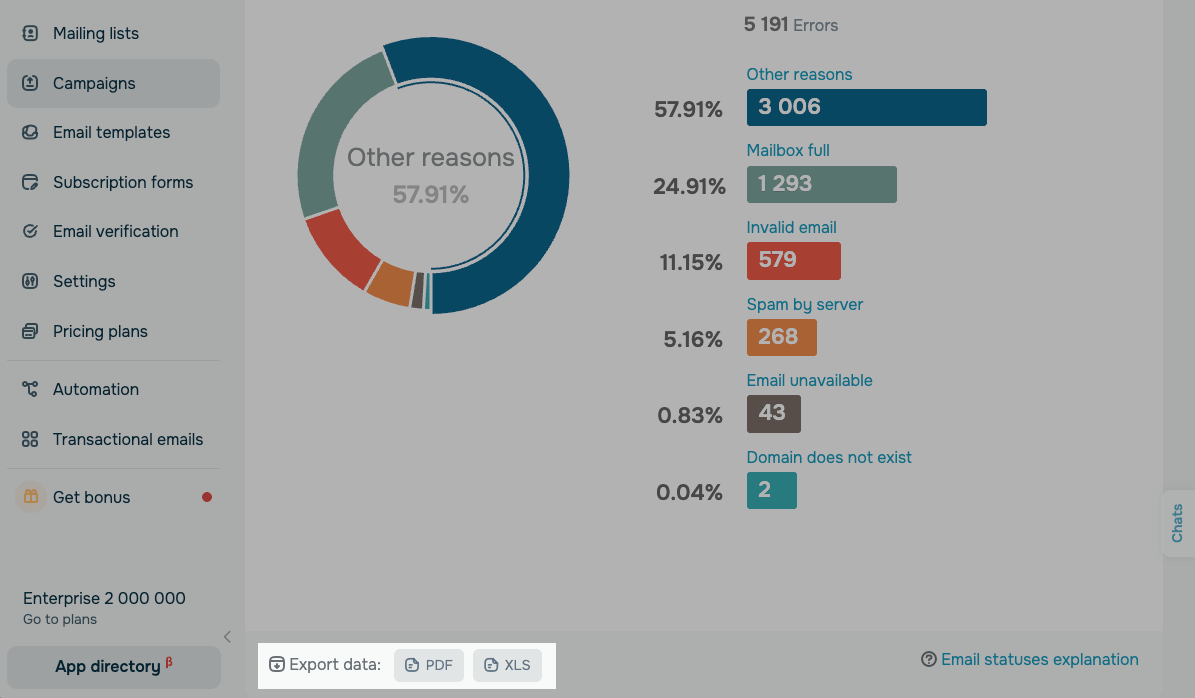
Export error statistics
This report shows delivery error data so that you can review this information outside SendPulse.
You can export error statistics to check for deliverability issues and compile a report for your team.
Go to the Error statistics tab. Scroll to Export data. Select a data format, such as PDF or XLS.
To learn what each recipient status means, see Email statuses.
Last Updated: 07.12.2023
or