You probably have an idea of who your customers are, but how well do you really know them? Each customer has specific wants and needs, and while traditional marketing tactics have worked in the past to determine these, your best bet to sustain growth in today’s business climate is to use data-driven marketing tools, like recency, frequency, and monetary (RFM) analysis.
In the following sections, we’ll go over exactly what RFM analysis is, how to calculate it, and how to use it to boost your marketing performance.
What Is an RFM analysis?
You’ve probably heard of — and maybe even used — demographics to target customers, but unfortunately, demographics alone don’t give you a clear picture of a customer’s life cycle within your business. Like the switch from manually operated business functions to automating processes, market research has changed in recent years.
So, how can you break customer activity down even further to clearly see purchasing behavior? Enter RFM analysis. RFM analysis categorizes your customers based on how recently they’ve purchased, how frequently they’ve purchased, and how much money they’ve spent.
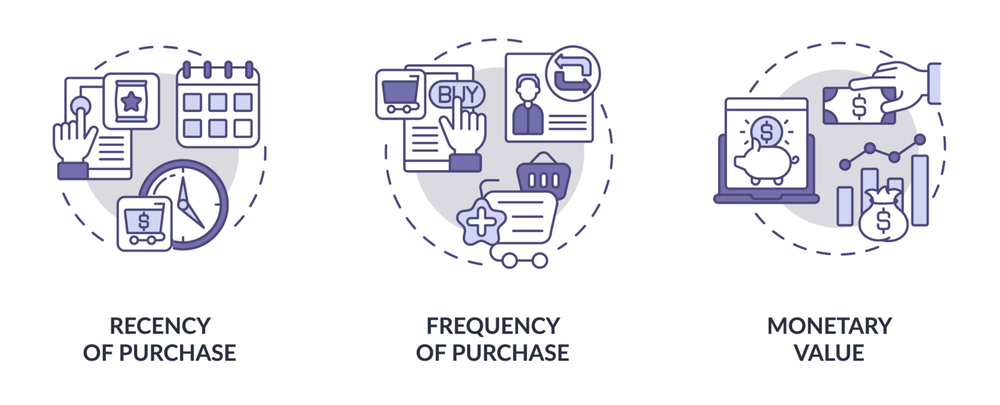
 The RFM model helps you score your customers based on three factors; source: Rittman Analytics
Let’s dig a little deeper into these three main categories:
- Recency. This is determined by how recently a customer has purchased your product or service. It can be calculated using business-specific filters, for example, purchases made in the last day, seven days, two weeks, etc.
- Frequency. This is determined by how often a customer has purchased your product or service within a specific timeframe. Again, this calculation is business-specific. Frequency is a good indicator of customer enthusiasm for your product.
- Monetary. This is determined by how much a customer spends when they make a purchase from your business.
To complete an RFM analysis, each of these categories is given a numbered score. This score will give you a complete customer profile that can help you make business decisions to reach specific customers in a deeper way than with traditional segmentation.
We’ll go over how to calculate this score later, but first, let’s look at how RFM analysis differs from traditional marketing methods.
Why is RFM analysis better than traditional segmentation methods?
The story of RFM analysis versus traditional segmentation methods is one of data. Before the widespread use of data analysis, market research companies would use demographic and psychographic factors to group customers.
Demographic: Groups of customers and potential customers identified by specific characteristics like age, gender, income, occupation, etc.
Psychographic: Groups of customers and potential customers identified by specific psychological traits like personality, values, attitudes, interests, etc.
Data tells a simpler story. RFM analysis is a data-centric model based on an entire customer population set. By using data collected from an RFM analysis, your business can define interactions with each customer, resulting in specific messaging and higher customer satisfaction.
The benefits of RFM analysis
By using data from an RFM analysis, you can better understand your customers and dig deeper into their purchasing behaviors. Here are some of the questions an RFM analysis can help you answer:
- Who is your typical customer?
- Which customers have the potential to buy more?
- Which customers are on the brink of churning?
- Which customers are on the cusp of becoming loyal, lifetime customers?
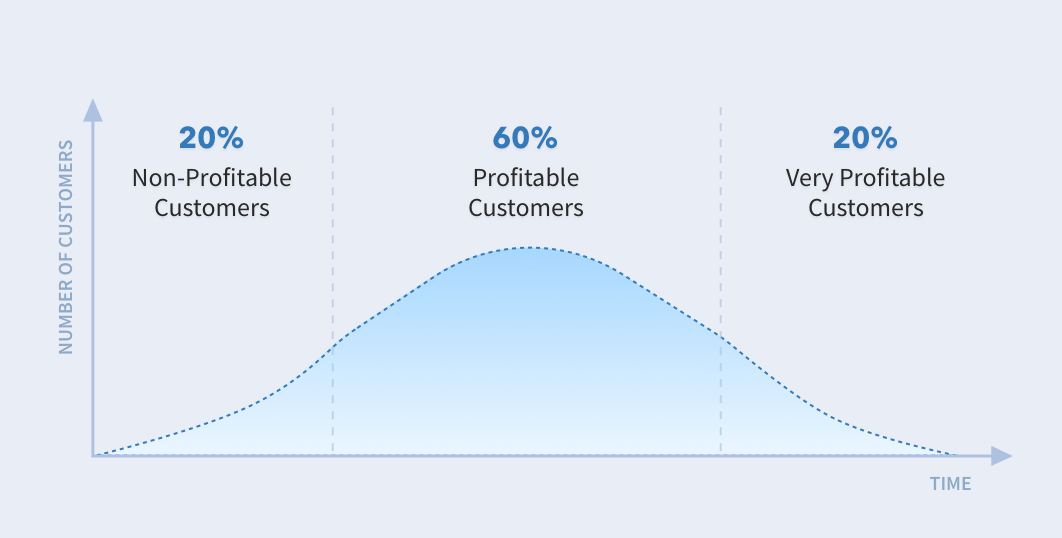
By answering these questions and focusing on your RFM analysis, you’ll be able to improve customer retention and optimize customer lifetime value. As a result of retaining customers, you’ll lower acquisition costs and know which purchasers are worth your efforts and which ones will churn no matter what you do.
 How much net profit your company can make of one customer over time; source: Retently
How to calculate RFM scores
Firstly, you’ll need to organize your customer purchase data. While you could keep track of this in a spreadsheet, we recommend that you invest in a customer relationship management (CRM) solution or customer engagement management software to organize customer data. Once you’ve done this, determine a purchase rate time range specific to your business.
For example, if a customer that purchases every two weeks is a great customer, then aim for six months to a year as your purchase rate time range. A shorter range will be more insightful, but it needs to make sense for your business.
Once your data is organized and you have a purchase rate time range to work from, you can sort each customer’s data into recency value, frequency value, and monetary value. It’s best to keep this part relatively simple so you don’t feel overwhelmed with data.
Here’s an example:
| Customer |
Most recent purchase |
Purchase frequency |
Total amount spent |
| Customer A |
One week ago |
Every two months |
$400 |
| Customer B |
Four months ago |
Once a year |
$1200 |
| Customer C |
Two weeks ago |
Every three weeks |
$600 |
Now you can create your scoring system:
| Score |
Most recent purchase |
Purchase frequency |
Total amount spent |
| 1 |
The past 12 months |
Once a year |
$0-500 |
| 2 |
The past six months |
Every six months |
$500-1000 |
| 3 |
The past month |
Every month |
$1000-1500 |
Finally, put it all together and score your customers. Based on the above criteria, here’s what our RFM analysis would look like:
| Customer |
Most recent purchase |
Purchase frequency |
Total amount spent |
| Customer A |
3 |
2 |
1 |
| Customer B |
2 |
1 |
3 |
| Customer C |
3 |
3 |
2 |
So, Customer A is a 321 — they made a recent purchase, they buy twice a year, and they don’t spend much.
Customer B is a 213 — they made a purchase a while ago, they only buy once a year, but they spend a lot of money.
Customer C is a 332 — they made a purchase recently, they make purchases frequently, and they spend a fair amount.
The magic of RFM analysis is that it clearly shows your highest and lowest-scoring customers. Customer C is our highest-scoring customer, while Customer B is our lowest. With this information, we can tailor messaging and strategy to directly address these customers based on their behaviors.
How to create an RFM analysis strategy
After you’ve completed your RFM analysis, it’s time to turn your results into actionable strategies. Target loyal, higher-scoring customers with deals and offers like:
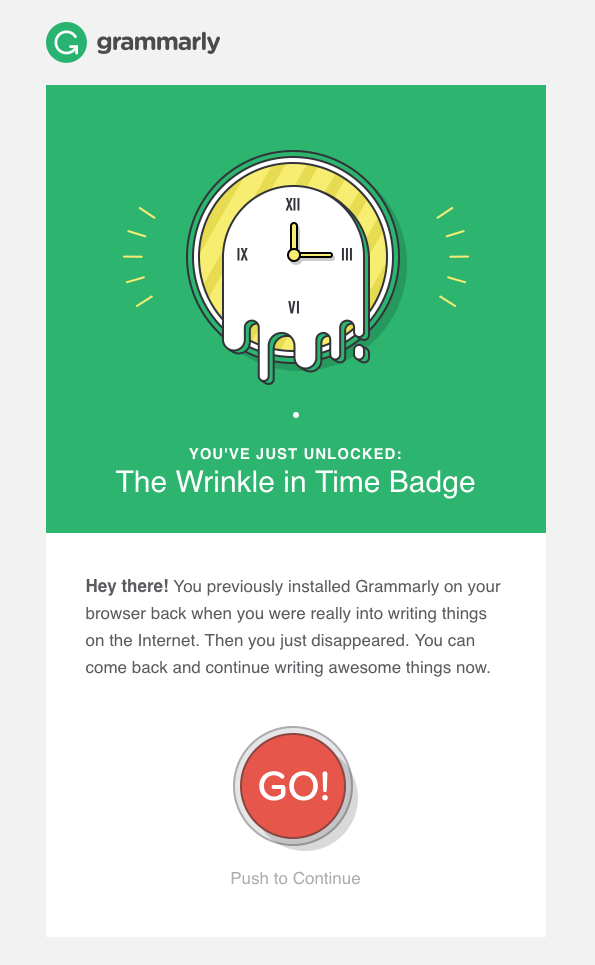
And your lower-scoring customers? Remind them you’re still there with re-engagement emails. Here’s an example from Grammarly:
 Remind your lower-scoring customers about yourself; source: Really Good Emails
For all of your customers that fall somewhere in between, determine their strengths and weaknesses as a customer and target them with specific campaigns. For example, a customer who’s recently purchased an all-in-one business workspace platform for their remote team may respond well to marketing for an eBook about how to manage remote workers. Remember to only send each group campaigns and offers they’ll find interesting.
Here are some examples of customer groups:
- Champions: Your brand ambassadors, so to speak. They score the highest and create positive buzz about your brand within their circles.
- Likely loyalists: Customers who spend a lot of money and need to feel valued to become champion customers.
- Loyal customers: Are happy with your product or service and use it frequently. They are unlikely to switch to an alternative service, but it’s important to keep them happy.
- New users: New to your product or service and need to be nurtured to grow into loyal customers. This group should receive constant monitoring.
- Keep an eye on: These customers are at risk of leaving. Check in on their behaviors to determine why they might leave. Personalize messaging to improve brand trust and loyalty.
- About to sleep: Existing customers who haven’t made a purchase recently. Make a push with hyper-relevant marketing to re-engage this customer.
- Lost cause: These customers have stopped using your product or service and found an alternative.
You can tailor your RFM analysis strategy to directly address these different customer segments. 90 percent of leading marketers say personalization significantly contributes to profitability.
The great thing about RFM analysis is that you can constantly adjust and analyze your marketing approach based on where your customers are and how they’re behaving. That means more personalization, more profitability, and increased customer value too.
A final note
We’ve covered RFM analysis from top to bottom. You should now have everything you need to implement an RFM analysis for your business, including an understanding of:
- what an RFM analysis is;
- why an RFM analysis is better for your business than traditional segmentation methods;
- the benefits of RFM analysis;
- how to calculate RFM analysis scores;
- what to do with your RFM analysis information.
Remember to focus your RFM analysis implementation on all of your purchasers, not just the new ones. You already know the costs behind acquiring fresh customers, so pay attention to and reward your existing clientele for their loyalty too.
In the end, you’ll have a better understanding of who your customers are and what they value from your business.