Converting email recipients to active leads is the first step in establishing a relationship between your business and your audience. Designing and analyzing your landing page is a key link in the conversion chain. By analyzing your landing page, you can fine-tune its effectiveness and maximize conversions.
This article will help you learn how to monitor the success of your landing pages, show you the metrics you should track and how to interpret them.
What is a landing page analysis?
A landing page is a web page that is specifically designed to turn visitors into leads. Most landing pages have a data collection form, a call to action (CTA) button, and few, if any, distractions, such as links to other pages.
Below is a typical landing page that offers free content in exchange for user data, that the user inputs after clicking on the button:
 An example of a landing page that offers a free PDF copy of a marketing report
Research shows that most users who visit landing pages take just a few seconds to decide whether or not to click through, which means that the time between their first impression of the landing page and the moment they decide to take action are crucial.
Here is an illustration of that thought process:
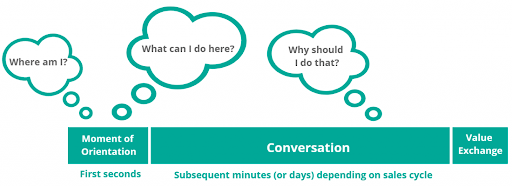 A typical landing page visitor’s experience; source: HostDGTL
The first few seconds are crucial as they define how the user experiences the landing page. Because they’ve probably landed on your page from another website, they are still in the process of figuring out what’s in front of them. Once users figure out where they are and what they’re supposed to do, they start asking how and why they’re supposed to take action.
Landing page analysis is a process that helps you identify different factors that affect landing page performance and the steps you can take to improve it. It looks at the three phases of the landing page experience illustrated above:
- Moment of orientation. The easier it is for the user to understand the landing page, the faster they will figure out what they need to do. This involves the appearance of the page itself and any images that appear on it.
- Conversation. This is where the page tries to communicate with the user to convince them to go click on the button. This involves the pages’ copy, which explains the product or service and what the user has to gain from trying it.
- Value exchange. This is the moment of truth when the user decides that the advantages of clicking on the button outweigh the disadvantages. If the user sees that the landing page offers something of value, they may decide to click through. Otherwise, they will leave the page.
One weak link in the user experience can render the other parts of the landing page useless. For example, even if the copy is clear and convincing, the user won’t be able to click through if they can’t find the CTA button. Likewise, poorly written copy will diminish the effectiveness of a good design or prominent CTA.
When you perform landing page analysis, you break down your landing page into its individual components, see how each component performs, then decipher how each component contributes to the overall experience of the page.
Why should you conduct a landing page analysis?
A systematic analysis of your landing page will help keep your email campaigns on track and optimize the results of your marketing campaigns. When you have fewer landing page conversions than expected, your cost per lead goes up and you have to figure out how to attract more conversions to minimize your overall marketing cost.
The first reaction of most online marketers is to start switching the photos they use, improving the page template, changing the color of the CTA button, and running an A/B test to see the results of your changes.
However, while these can be effective in the short term, they might not give you the long-term traffic you want. While some things like page load speed depend on your web hosting service, doing a landing page analysis helps you get actionable tips on how to make your site visits count.
Many landing pages also depend on offering free content, also known as “lead magnets,” to get users to convert. If the visitor doesn’t see value in the lead magnet, you’re not going to get very many conversions.
Here are a few more points to consider when analyzing your landing page:
- сompare your landing pages — especially if you have multiple pages, each with a different offer — to see if you can spot a trend as to why some are doing better than others;
- re-promote a high-performing landing page to increase conversions;
- make one modification at a time to your landing pages (e.g., copy, photos, form fields, lead magnet) and test them thoroughly.
These actions will enable you to pinpoint the variables that have the greatest impact on your results. You won’t know which changes are making the landing page perform better if you make several changes at once, and you won’t be able to apply this knowledge to your other landing pages to optimize them.
How to use Google Analytics to analyze your landing page
Using Google Analytics to track landing pages enables you to identify high-converting pages and focus your organic marketing, paid ads, and SEO marketing activities on these pages. Since landing pages are also gateways to the rest of your content, whether it’s in an email or elsewhere on your website, you need to know whether they are performing up to your standards.
Here’s how to use Google Analytics to identify and improve your best landing pages.
The number of target completions — i.e., Goals generated in Analytics — versus the number of users who saw the page is one metric that Google Analytics tracks as part of its Landing Pages. In the example below, you will see how Google tracks the performance of landing pages according to different metrics.
The reports from these menus are helpful for search engine marketing because they display critical information such as sessions, bounce rates, and pages per session. Since both SEO and search engine PPC depend on monitoring landing pages in Google Analytics to understand results, it can be used for both.
In the example below, you can see a graph that displays the number of visitors per day over a chosen date range, as well as a set of filters that allow you to dig deeper into the data.
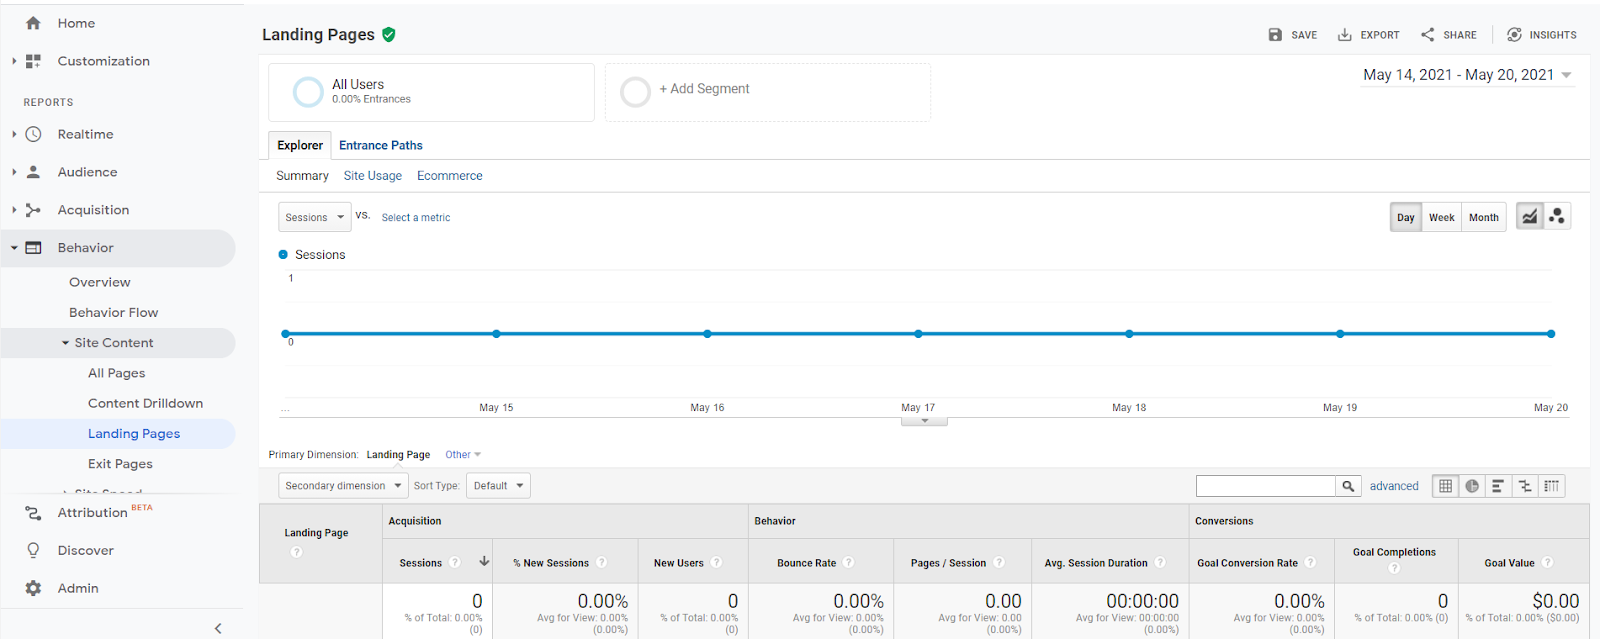 Using Google Analytics for a landing page analysis
Your landing pages are ranked in descending order based on the number of clicks they generate. By clicking on the column headings, you can select and sort the data using any variable on the list.
Here are the column headings you can find in the Google Analytics Landing Pages report:
- Sessions. The cumulative number of times this was a visitor’s first page.
- Percentage New Sessions. The proportion of new visitors versus the total number of sessions.
- New Users. The cumulative number of people who have seen the website for the very first time during the selected time span.
- Bounce Rate. The number of people who just looked at this webpage and quickly left it.
- Pages/Sessions. The number of cumulative pages on your website seen by visitors of this landing page.
- Average Session Duration. The total amount of time spent on the website.
- Goal Conversion Rate. The percentage of sessions that resulted in conversions.
- Goal Conversions. The number of times that a user performs an action, such as a click-through.
- Goal Value. The total value produced by goal conversions, which is calculated by multiplying the number of goal conversions by the constant value you have assigned to the goal.
These are just a few of the metrics that Google Analytics allows you to monitor. The challenge is choosing which information to gather and figuring out how to apply those insights to your business.
Essential landing page metrics to track
Google Analytics lets you measure dozens, if not hundreds, of data points. However, if you’re pressed for time or are still feeling your way through the whole landing page business, you can initially focus on the five main metrics.
Bounce rate
The bounce rate is the ratio of users who leave your site after visiting one page versus the total number of visitors. When your bounce rate is high, it means the content on your landing page did not meet your users’ expectations or that they were not interested in following your call to action.
A high bounce rate may also indicate the following common issues:
- visitors were uncertain of what steps they should take because your offer was unclear;
- your offer could have been better;
- visitors were confused when they arrived at the landing page because the campaign promotion and messaging was vague or confusing.
In your Google Analytics account, navigate to Behavior > Site Content > Landing Pages to find the landing page’s bounce rate. You can find the URL for your landing page in the All Pages section and then click on it.
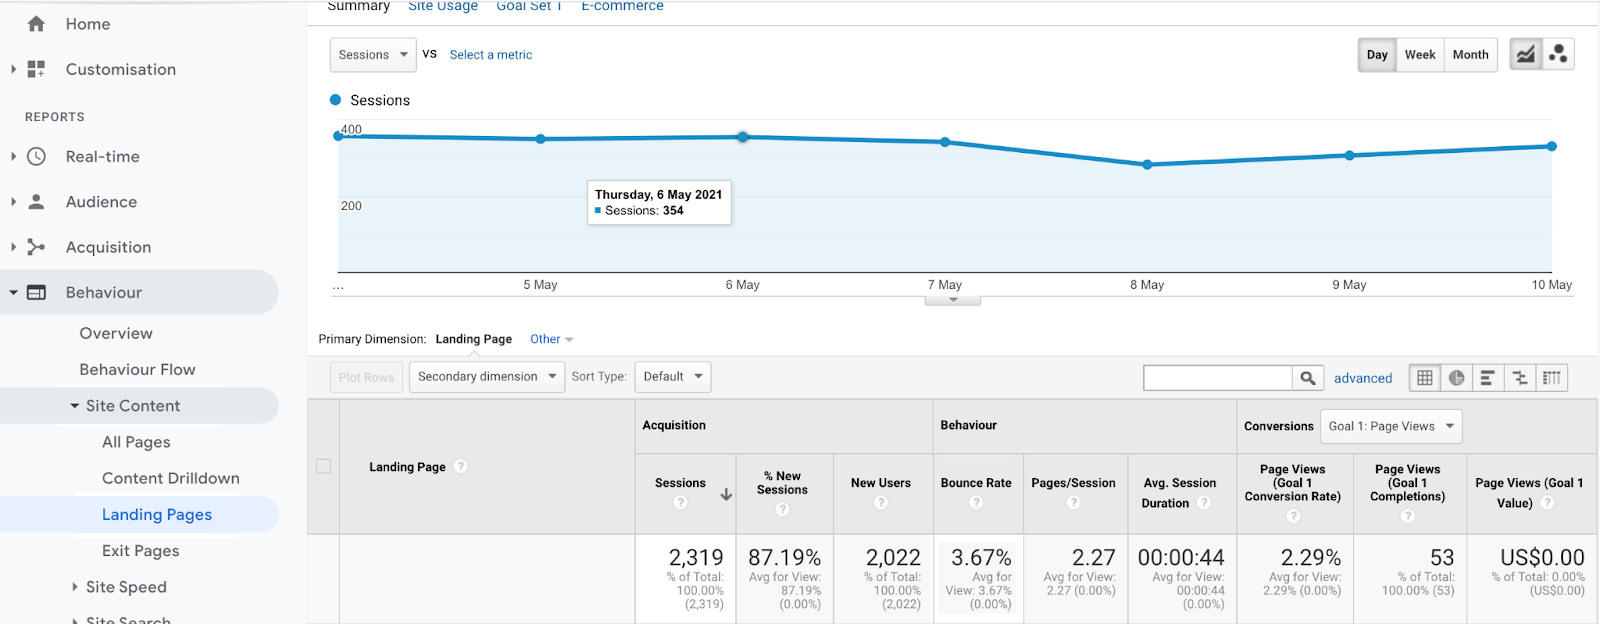 A sample landing page report that shows the bounce rate value
You can see your landing page’s bounce rate at the top of the report. You can sort and filter your landing page according to bounce rate and other metrics.
Conversion by source
One of the most important facets of landing page research is knowing where the traffic is coming from. This information will help you determine what is and is not working in your campaign.
Learn the specifics of different
website traffic sources and how to understand which of them are worth investing in.
Suppose you’re tracking an educational site that sells online courses. In that case, you’ll want to assess your organic reach as well as whether platforms like Facebook advertising are boosting your traffic and conversion rates.
Analyzing landing page sessions will help you see which advertising platforms are working for you if you’re watching a lead generation offer. Where does your traffic originate from? Is it from websites, social media, or email?
In Google Analytics, go to Behavior > Site Content > Landing Pages to see where the traffic to your landing page is coming from. Find and click on your landing page’s URL in the All Pages window. Then, for the source, create a second dimension.
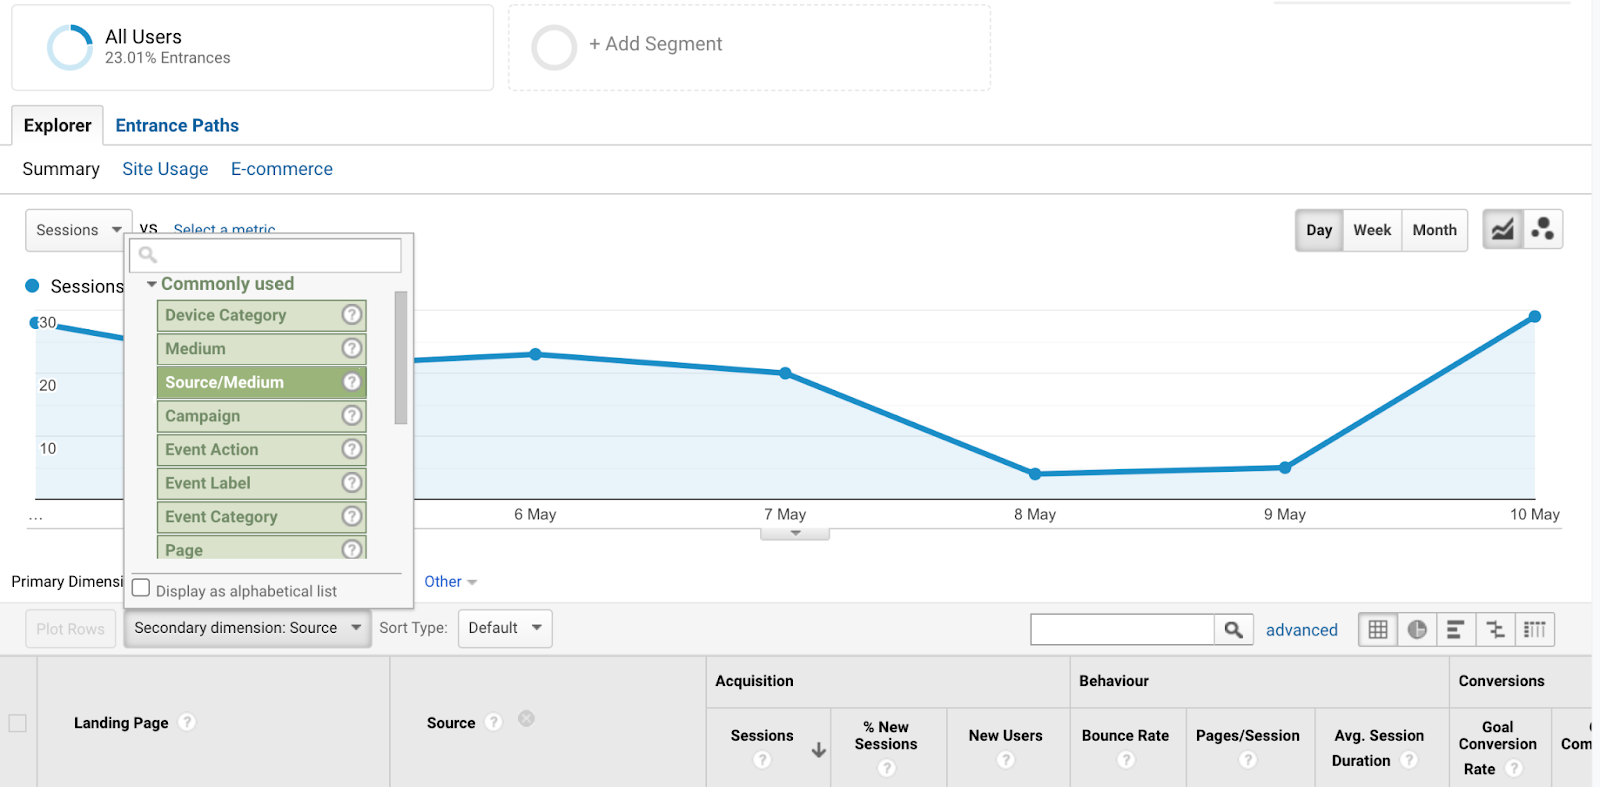 A sample landing page report that uses Source as a secondary dimension
This will add a new column to the chart that shows the source of your landing page views and additional stats for each source, such as time on page and the bounce rate.
Conversion rate
Not everyone who visits your landing page will click on your CTA button, but you can at least measure how many visitors do click on it. The conversion rate is described as the ratio of visitors who respond to a call to action to your total number of visitors.
To measure your conversion rate, start by setting up goals in Google Analytics to monitor conversions on your landing page. You can track how many people accessed your landing page and took action by filling out a form, or by clicking on a link or our CTA button. Make sure you send out a thank you email to all the visitors who converted to leads.
Discover some
lead generation tips that will allow you to capture as many leads on your page as possible.
Once you’ve set up conversion goals, you can use Google Analytics to monitor your number of conversions and the percentage of visitors who converted. Navigate to Conversions > Goals > Overview to locate this data.
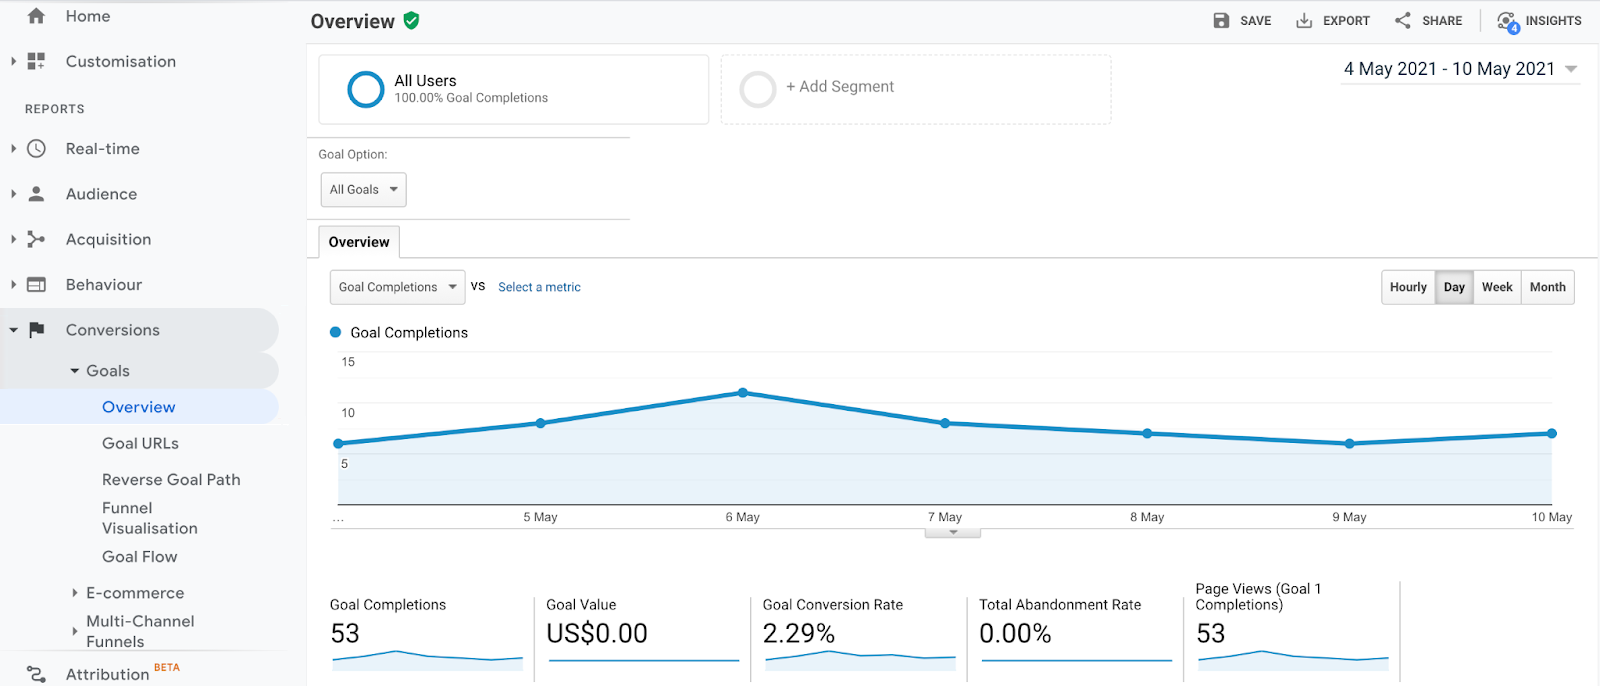 A sample conversion report for a landing page
Your landing page aims to turn guests into paying customers. If your review of landing page metrics reveals that you are not converting at an optimum rate, you might need to find ways to increase the conversion rate of your landing page.
Time on page
It’s essential to keep track of how much time people spend on your landing page. For example, if you have an academic landing page and people spend time on your page, it indicates that the content you have is relevant to your audience of academics. If you’re running an eСommerce site, it could also indicate that people find your products interesting.
If the total time on your website is short, you might want to improve the quality of the content on your landing page. For example, the copy might be too confusing for your target market to understand, or there might not be any copy at all. It could also take so long to load that users lose interest and decide to leave altogether.
In your Google Analytics account, navigate to Behavior > Site Content > Landing Pages to find the total time spent on the website for your landing page. You will find the URL for your landing page in the All Pages view and click on it. This report reveals the average time spent on page.
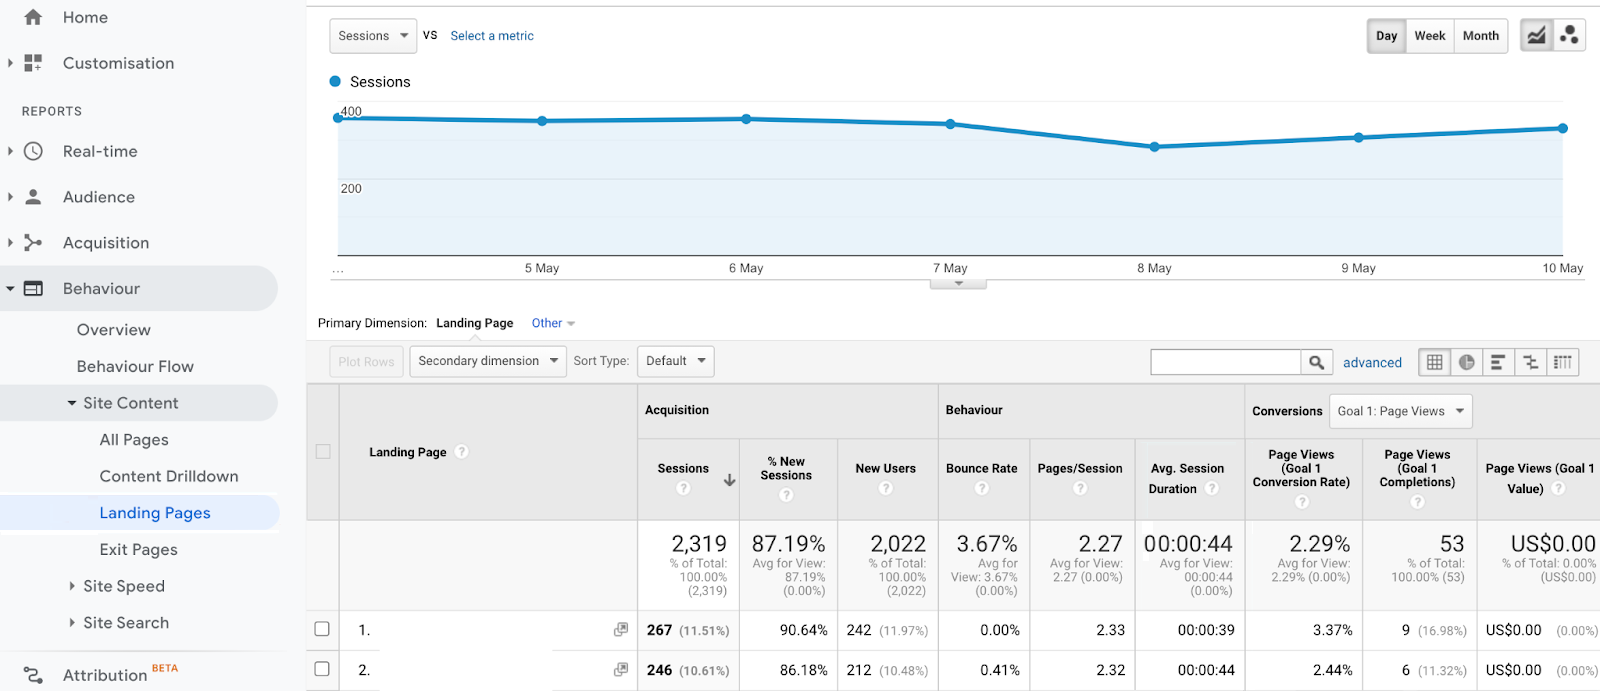 A sample session duration report for a landing page
Users flow
The Users Flow report is a graphical overview of the paths users followed through the web, from beginning to the end, and where they exited.
When you scroll down in Google Analytics, you’ll see the Users Flow in the Audience area. The Users Flow now begins with the country of origin as the default starting point.
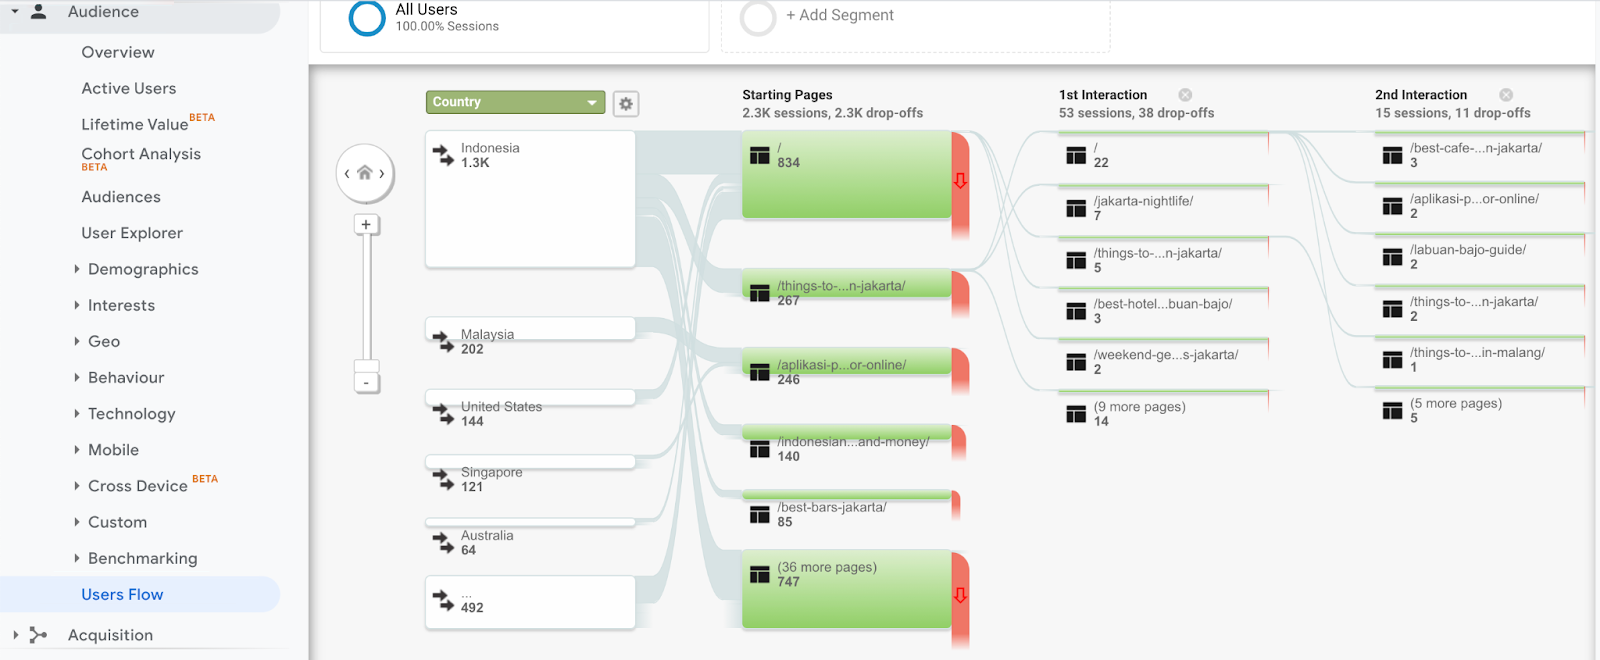 A sample users flow report for a landing page
The Users Flow will help you figure out what people really want. People who find you with an organic search, for example, are likely to be looking for specific information, while those who have come from social media are searching for entertainment. And most of all, you want people who have come from a focused email campaign to convert.
In the Users Flow section, you can select variables to analyze traffic from multiple channels and landing pages. These variables can help you identify user intent and determine the probability of conversions coming from different sources.
Summing up
Analyzing your landing page offers you a strategic advantage over your competitors and can help boost the impact of your marketing campaigns. You will not only have a lot of data to back up your decisions after the assessment phase, but you will also gain rich insight into the efficiency of your landing pages.
There is no single method or metric that you should focus on when it comes to landing page optimization. Instead, you should use various resources to get a broad image of your landing page’s success and make improvements as required to boost your overall results.