Customer success metrics are a subset of key performance indicators or KPIs that help you wrap your head around how your brand’s marketing efforts are working. There are hundreds of KPIs, and each of them is useful in their own way. Today we’re going to look closely at some important customer success KPIs to keep an eye on to inform your future marketing campaigns and let you know what works best.
Each metric will give you a piece of your overall performance puzzle. To get the full picture, you will need to rely on several metrics and look closely at what they are telling you. We will get into detail a little later on, but now all you need to know is that looking at only a few is not enough to get the full view. Likewise, it’s a good idea to check in on your customer success metrics regularly. But, fear not, with a little time and some research you can start tracking your KPIs too. The formulas are simple and straightforward and in a few minutes, you will have a full report.
What is customer success?
Customer success is a broad term meaning that customers are pleased with the results of their interactions with your brand. This means providing excellent service, giving customers value, and keeping them engaged. Taking a customer-centric approach by listening closely to feedback and acting on your promises will allow your brand to succeed in sales and conversions while also pleasing your clientele.
Making customer success a priority will be mutually beneficial for you and your customers. Customers are so much more likely to return to a brand that takes care of their needs. Later in the post we’ll give you some tips on how to improve your customer relations. For now, it’s important to remember that this process benefits not only your customers, but also your bottom line.
How is customer success measured?
So we know that you should be checking up on some stats to understand how your brand is performing, but how exactly does one do just that? This is not the easiest question to answer. There are hundreds of KPIs, and it is really easy to get lost in a sea of formulas. Most experts recommend focusing on just a few KPIs and doing what you can to boost your numbers.
Every customer success KPI has a different formula, so there is no “one metric” to calculate customer success. The good news is that the numbers that you are already tracking are most of the numbers that you need to calculate your results. Things like sales should be tracked by your accounting team already. Likewise, checking on how many new subscribers you got is likely tracked by your CRM, and your marketing performance is tracked by the platform that you use. Now, all you need to do is get out your calculator and crunch some numbers.
Five useful customer success metrics
Here we have assembled five powerful and easy to calculate customer success KPIs to help you assess your performance. Each of these KPIs are used by businesses everyday, and for good reason, they really shed light on customer behavior and can show you your strengths and weaknesses. Let’s dig in!
Customer retention rate (CRR)
This is a great customer success KPI to start with because it represents your brand’s ability to keep existing customers engaged with your brand. Why is this important? Research from the marketing consultant agency, Invesp, found that it is up to 5 times cheaper to keep an existing customer than it is to acquire a new customer. The numbers speak for themselves. Despite this, 44% of the businesses surveyed still put more effort into customer acquisition than they did into customer retention.
Let’s look at how to calculate your customer retention rate, and then we’ll talk about how to optimize it. All that you need to know is basic stats about your number of customers.

Here are the variables that you need to get your customer retention rate:
- E = customers at the end of a given period
- N = customers acquired during the same period
- S = the number of customers at the start of the period
After you run the numbers, you will be left with a percentage. This will tell you what percentage of your customers stayed with your brand over a given period. Imagine that you have ended your quarter with 3,500 customers and acquired 200 new customers, and began with 3,375. Let’s crunch the numbers.
3,500 – 200 / 3,375 × 100 = 97.77%
In this example, you will have a CRR of 97.77%, a great customer retention rate.
Every industry has different trends in their retention rate, but your goal is to keep this percentage as high as possible. Aim for at least 90%. If you’re having trouble retaining customers, try some of the following tips:
- Provide excellent customer service. Give your loyal customers the best experience with your brand. Be there to answer questions and help them 24/7. Customer service chatbots will help you be there at your customers’ beck and call.
- Listen to customer feedback. Sometimes it’s easy to forget that your customers are likely already telling you what they want. Check out your feedback forms and talk to your sales and support teams to learn what your customers want from you. Happy customers are returning customers.
- Use content marketing. Keep your subscribers engaged by sharing useful or entertaining content with them regularly. Consider using content marketing, or sharing fun content on social media. Giving your customers valuable content will keep them engaged and coming back for more.
Customer churn rate (CR)
Next, we have the customer churn rate. This customer success metric goes hand in hand with your customer retention rate. It represents the percentage of customers that stop doing business with your brand over a given period of time. Naturally, regardless of your efforts, you are going to lose some customers. Again, the ideal numbers vary from industry to industry, but you want to keep this rate as low as possible. Aim for less than 10%.
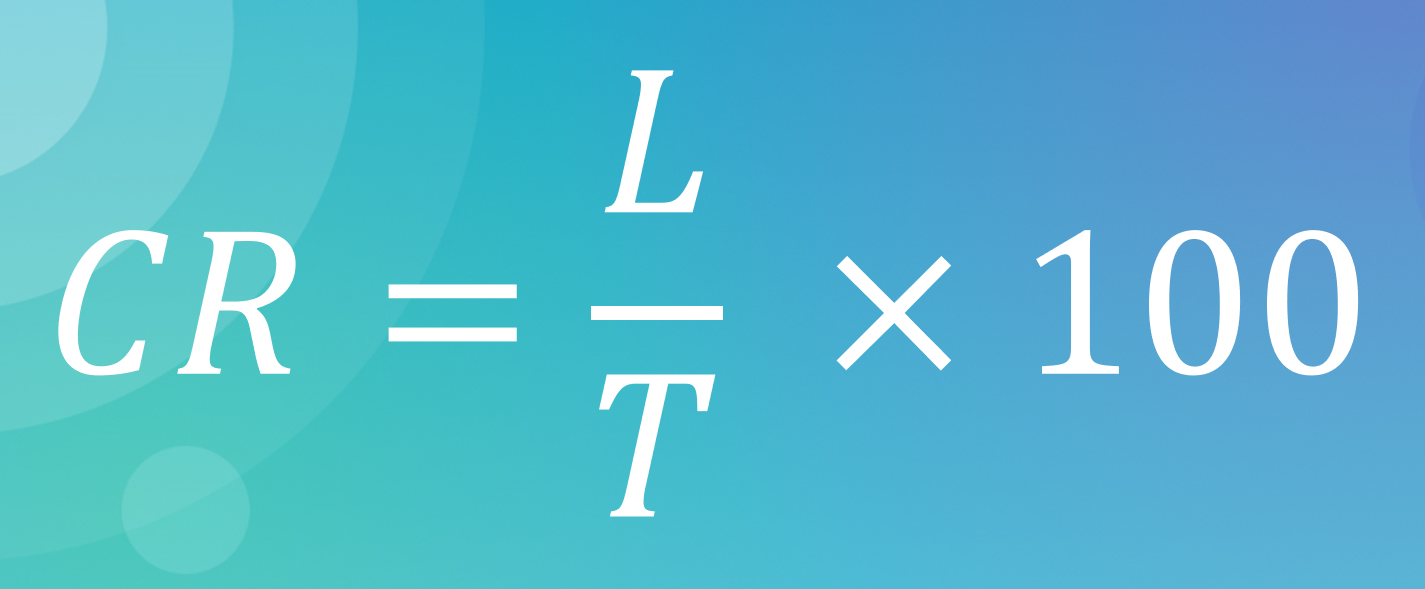
The good news for the math-phobic among you is that if you have already calculated your customer retention rate, simply subtract it from 100, and you’ll have your churn rate. But, in the interest of completeness, here’s the formula.

These are the variables you need to calculate your churn rate:
- L = the number of customers lost in a given period
- T = your total customers at the end of the same period
After you run the numbers, you will be left with a percentage of your users that you lost at the end of a given period. Imagine that you lost 50 customers in the last two weeks, but currently have 3,000 engaged customers. Here are the calculations.
50 / 3,000 × 100 = 1.67%
This shows that you have lost 1.67% of your customer base in the last two weeks. This is a great churn rate.The tips for keeping this number as low as possible are the same as for keeping your customer retention rate high. However, if you have already identified the customers that you lost, consider using re-engagement campaigns to win them back.
Customer acquisition cost (CAC)
The customer acquisition cost refers to the total price that you pay for marketing, employee wages, services, professional help, and other overhead to attract one paying customer. This customer success KPI will help you understand not only the cost of your efforts, but also help you know if your current strategy is budget-friendly and worth your while.
The formula looks scarier than it is, but you already have all of this data.

Here’s what you need to get your customer acquisition cost:
- MCC = marketing campaign costs
- W = wages, the wages of employees working on customer acquisition
- S = software, the cost of any platforms that you use for CRM, marketing, or analytics
- PS = professional services, the cost of any professional services you use in your campaigns like template design, etc.
- O = overhead, any other costs that are required for your customer acquisition efforts
- N = the total number of customers acquired within a given period
After you crunch the numbers you will be left with a dollar amount. This represents how much it cost to generate one customer on average. Let’s imagine that you want to calculate your customer acquisition cost for the previous quarter. You spend $1,500 on marketing and ad campaigns, paid an employee $1,000 to keep an eye on them for a few hours a week, spent $175 on marketing software, hired an email template designer for $125, spent $50 on overhead, and gained 700 customers in the last quarter. The calculations will look like this:
1,500 + 1,000 + 175 + 125 + 50 / 700 = 4.07
This means that, in the last quarter, you spent an average of $4.07 to acquire one new customer. This is an exceptional CAC. You want to calculate all of these variables for a specific time interval to generate your customer acquisition cost. For example, your quarterly or annual customer acquisition cost, as these numbers will change over time as you gain or lose customers or find ways to reduce your expenditures.
Here are some tips for reducing your customer acquisition cost:
- Try using more marketing channels. The more marketing channels you use, the more potential customers you will reach. Obviously, you want to do this as inexpensively as possible, but most marketing platforms allow users to make use of multiple channels cheaply and easily.
- Reduce your personnel costs. With marketing automation, you can greatly reduce the number of employees required for your marketing campaigns. This will lower your wage costs, and thus your overall expenditures for acquiring a new customer.
- Improve your targeting and segmentation. Using analytics, you can determine segments of your target audience that show the highest trends in purchasing behavior. With this information, you can actively target these people with campaigns and send fewer mass marketing campaigns, which can add up quickly.
Renewal rate (RR)
Admittedly, this customer success metric is only relevant for companies that use a subscription model, but it is crucial for those brands. This KPI tells you the percentage of users that renew their service plan from cycle to cycle. This is one that you want to keep an eye on overtime. If you notice sharp changes in the positive or negative direction, it is a good idea to take a look at what is driving the change.
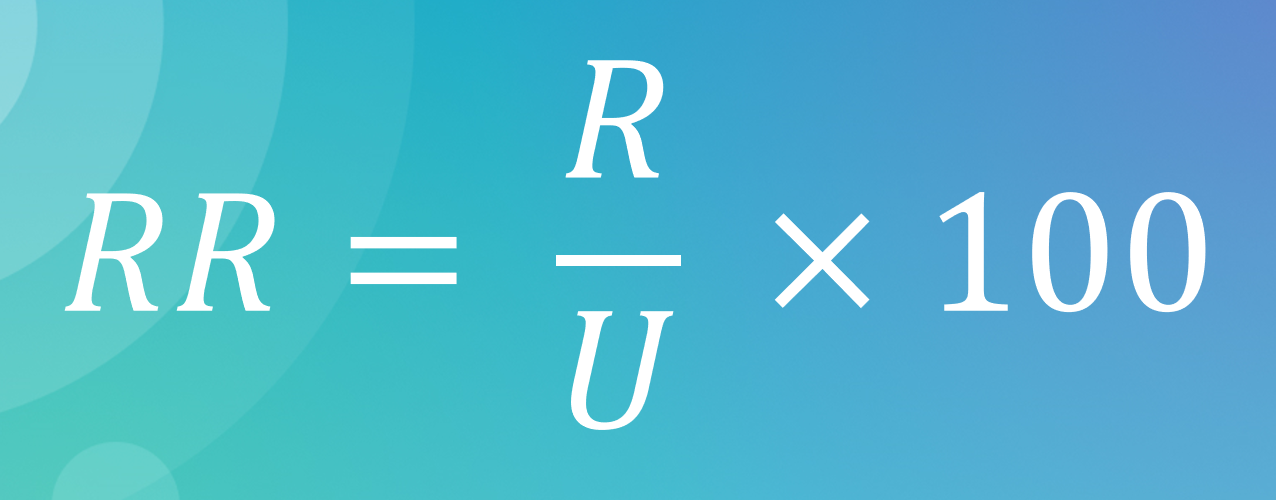
Just like the above formulas, you already have the variable values that you need in your CRM or even accounting documents. Here’s the formula.

These are the variables you need to calculate your renewal rate:
- R = the number of subscription renewals in a given period
- U = the number of subscriptions up for renewal in a given period
After you do the calculations, you will have a percentage that represents the percentage of users who renewed their subscription with your service in a given period. Imagine that you want to calculate your 2019 renewal rate. During the year you had 16,000 users renew their subscription, and a total of 18,400 accounts up for renewal.
16,000 / 18,400 × 100 = 86.95
In this example, you would have a renewal rate of 86.95%. This is nothing to sneeze at, but maybe you can try to hit 90% in 2020. Naturally, you want to keep this one as high as possible, losing loyal customers is bad for your brand in a multitude of ways. Let’s look at some steps you can take to bring up your renewal rate:
- Use email campaigns. If you send trigger emails to remind customers when their subscription is about to expire, they are more likely to reup their plan. Likewise, you can use automated email campaigns to offer discounts for people who have let their subscription lapse to entice them to come back.
- Run promotions. Offering discounts on annual plans is a great way to motivate customers who are on the fence about whether to take the plunge or not. Everyone loves a good deal.
- Remind users about the value you offer. It’s always a good idea to use your marketing know-how to clearly state the value that your service offers its users. Let people know what they would be missing out on without your service.
Net Promoter Score (NPS)
This single customer success metric can tell you so much about your business’s performance. Namely, it measures customer satisfaction, which you can use to predict your growth. It is considered one of the most important KPIs to keep an eye on. The process of calculating this one is slightly less straightforward than the other metrics we have talked about, but with a good email service you can do it without breaking a sweat.
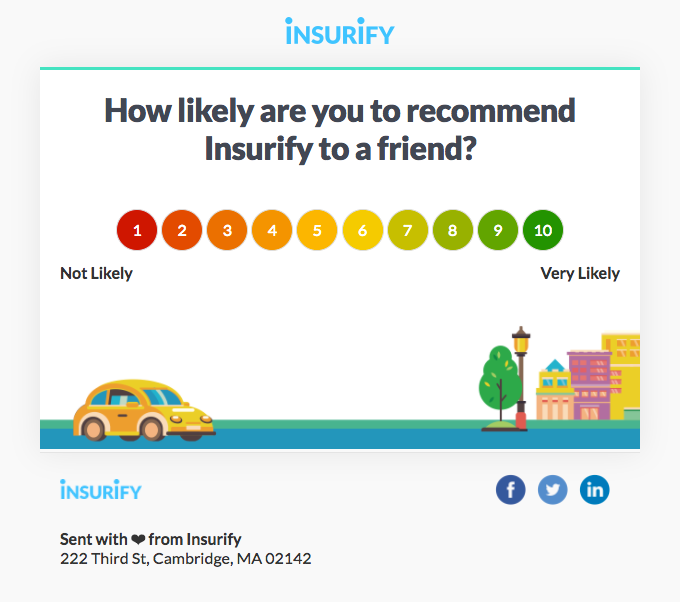
Your Net Promoter Score is calculated based on survey responses from your customers, typically sent via email. The survey has a single question: How likely is it that you would recommend [brand] to a friend or colleague? Customers can respond with a rating between 1 (not at all likely) and 10 (extremely likely). After you get your responses, you should separate respondents into three categories.
- Promoters. These are people who responded with a 9 or 10 on the survey. You know that these people are loyal brand advocates.
- Passives. These are people who responded with 7 or 8 on the survey. Passives are likely loyal customers, but are less likely to be brand advocates that your promoters.
- Detractors. These are people who answer between 1 and 6. Detractors are unhappy with your brand and can harm your brand by sharing their negative brand sentiments with others.
Here is an example NPS survey email from Insurify. You will notice that the email has no frills and simply asks how likely recipients are to recommend the brand to a friend. This is important because a simplistic email design is less likely to overwhelm your subscribers and reduce the chances of email fatigue, while improving your response rate.

Now, you need to gather the survey results and count up the number of respondents in each category, then use this simple formula.

The data comes from your survey results and respondents should be totaled for the categories mentioned above. Here are the variables that you need to get your Net Promoter Score:
- P = promoters
- D = detractors
- T = total respondents (including passives)
Let’s imagine that you sent out an email survey and got 2,200 total respondents. 1,700 answered with a 9 or 10, 350 responded with a 7 or 8, and 150 gave you a 6 or less. That means you have 1,700 promoters, 350 passive, and 150 detractors out of your 2,200 respondents. Let’s run the numbers.
1,700 – 150 / 2,200 × 100 = 70.45
This leaves you with a single figure, that is your Net Promoter Score. In our example, the score is 70.45. This is a very high score, and indicates a highly successful brand. Keeping your NPS high can be hard work, but it is a marker of success. Research from the Harvard Business School shows that higher Net Promoter Scores are positively correlated with higher revenue. So here’s what you do to boost your score:
- Provide top notch service. This metric is all about how happy your customers are, and fast and helpful service is an excellent place to start.
- Reach out to your detractors. We have mentioned this above, but make sure that you are listening to both your happy and unhappy customers. Listen to their feedback and try to make changes.
- Encourage promotion. Motivate your users to share their experiences with your brand. With branded hashtags and UGC opportunities, your passive customers are far more likely to become promoters.
Putting a bow on customer success metrics
Congratulations, you have learned a little more about how to calculate customer success KPIs! Remember that these numbers will change frequently for a number of reasons. If you run the number and want to see higher scores or better results, remember these tips to boost your customer success:
- Provide excellent customer service. Nothing will keep customers happy and coming back for more like a seamless experience with your support or sales staff. Make helping customers a top priority.
- Encourage feedback and act on it. Very often, your customers will simply tell you what they want. Listen to these ideas and take them seriously. Implementing changes will make customers happy and show them that their opinion matters.
- Try new things. A dynamic approach to customer success is critical in modern business. Something that works one quarter may become unpopular in the next. Keep an eye on market trends and your corresponding KPIs. Make adjustments accordingly.
- Use content marketing. Give people more touchpoints for interacting with your brand. The more high-quality content you put out, the more likely you are to find customers who are happy to promote your brand, share your content, and maybe even make some UGC.
Well, now you’re ready to get out your calculator and crunch the numbers. Don’t forget that you can use SendPulse for all of your marketing needs. From email, SMS, and web push notifications, to chatbots and more, SendPulse has you covered. Get started sending high quality campaigns for free!


